Weekly Market Review & Forecast
Market Brief
Nasdaq
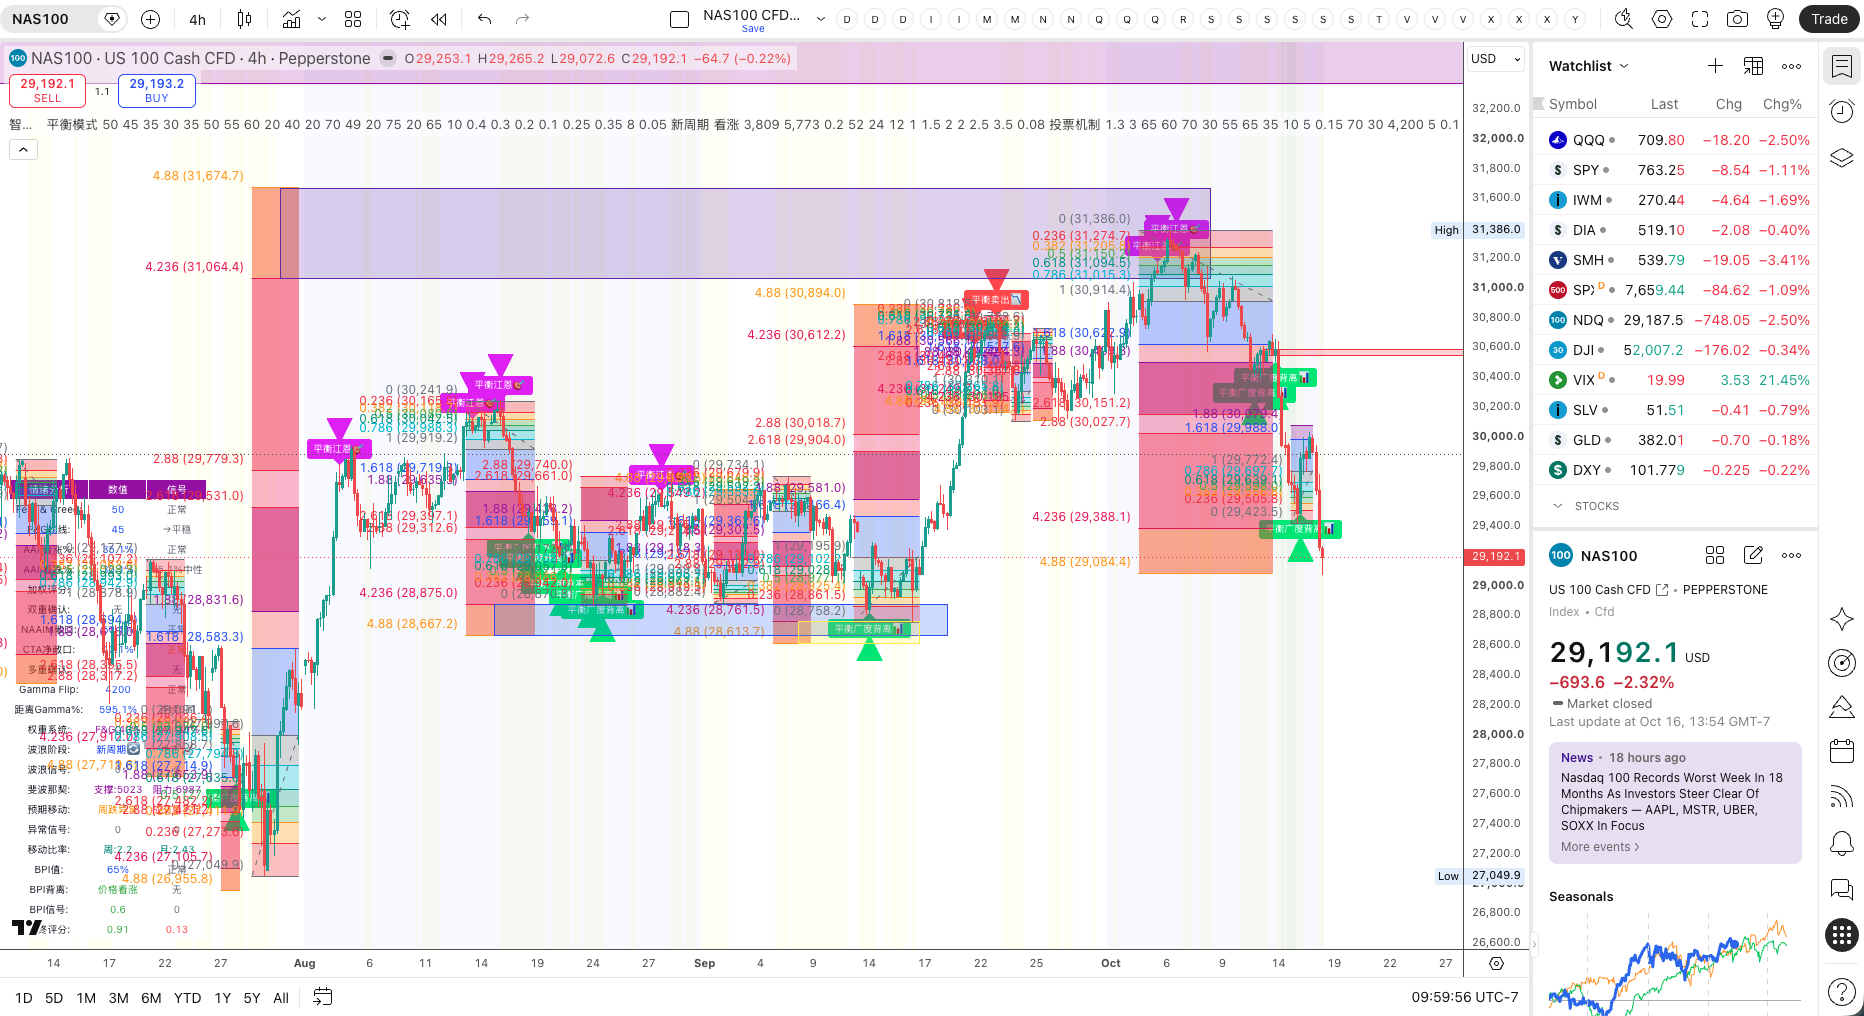 Let's start with Nasdaq. On 10/6 we arrived at TP3 of 1h & 4h major bullish signal, and pulled back thereafter. Now are sitting at TP3 extended area of 4h bearish signal.
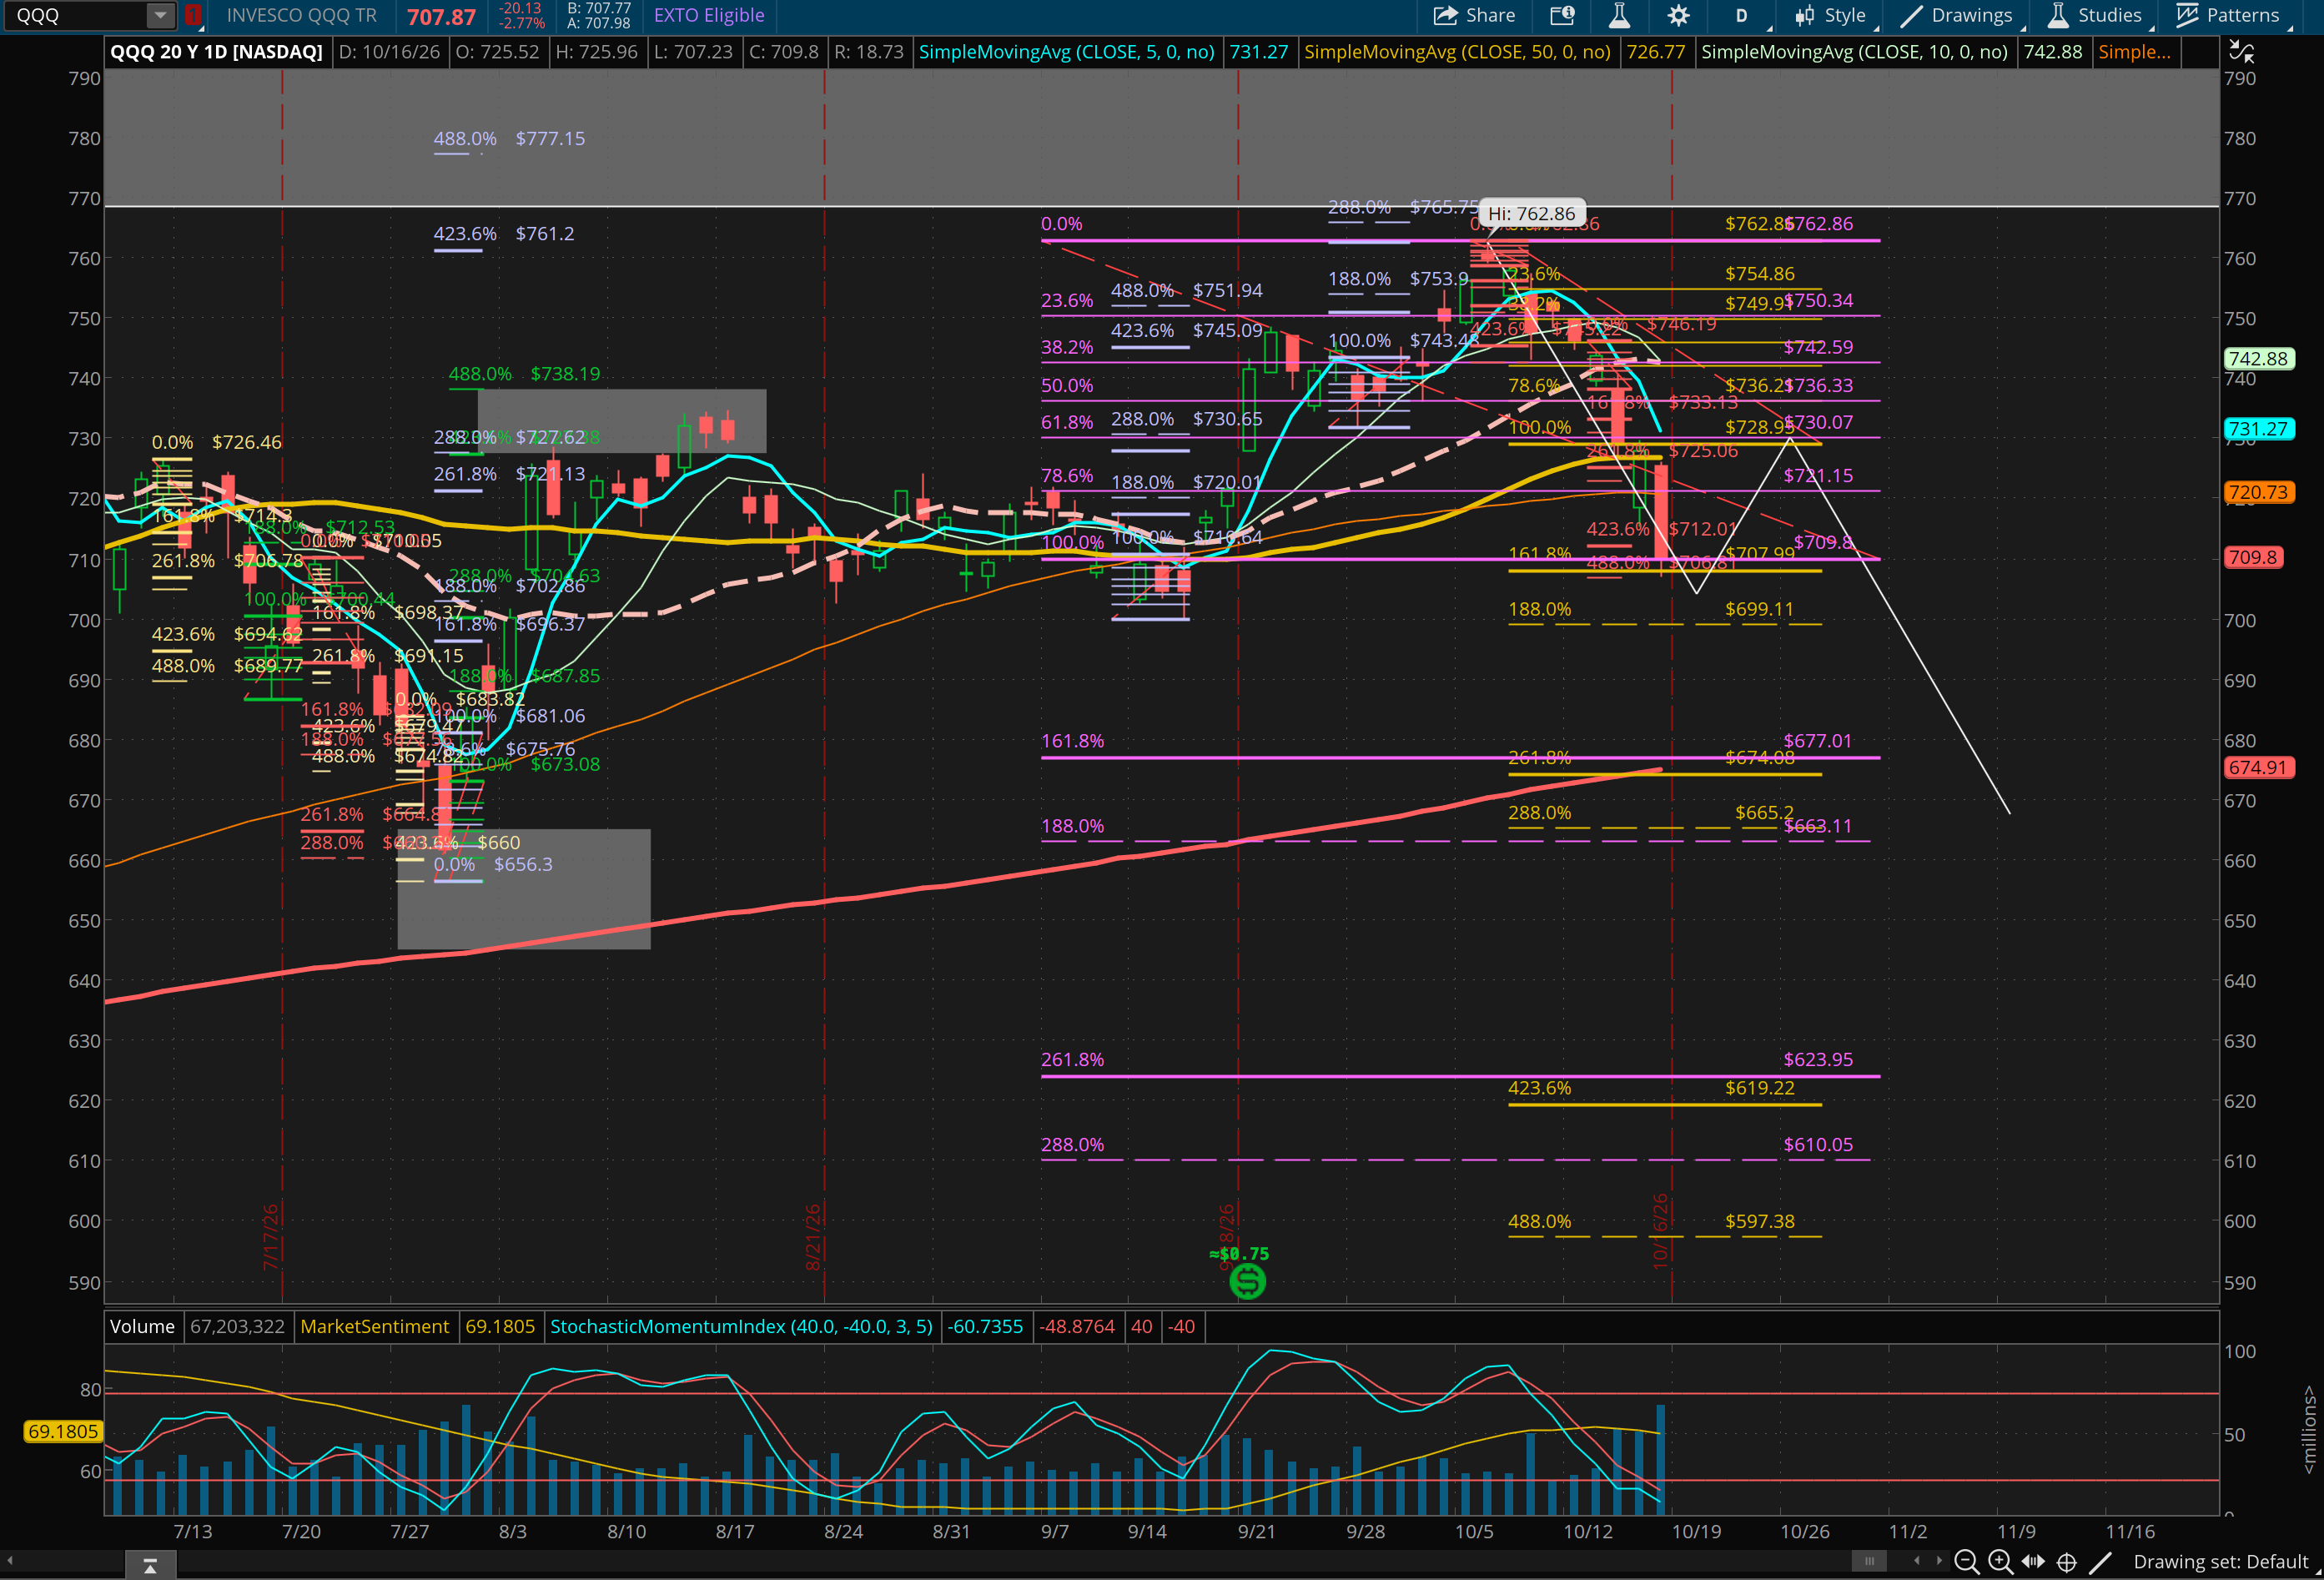 Now looking at the larger timeframe. QQQ triggered a daily bearish signal on Wednesday and quickly flushed down to slightly touch TP1 region on Friday. Note that We can still reach down a bit more into that zone before seeing a bigger bounce to the upside. It's not shown here but we are already outside the bottom Bollinger band quite a lot for QQQ, so a snatch back on Monday or Tuesday is imminent.
Also note that on Friday close, a new weekly bearish signal (purple) is triggered, so unfortunately that tells me that there's a 90% of chance that we are gonna drop to weekly TP1 area, which perfectly overlaps with daily TP2. So yes, I think we will very likely bottom there with a slightly higher low than 7/29 candle, and reverse the direction.
S&P 500
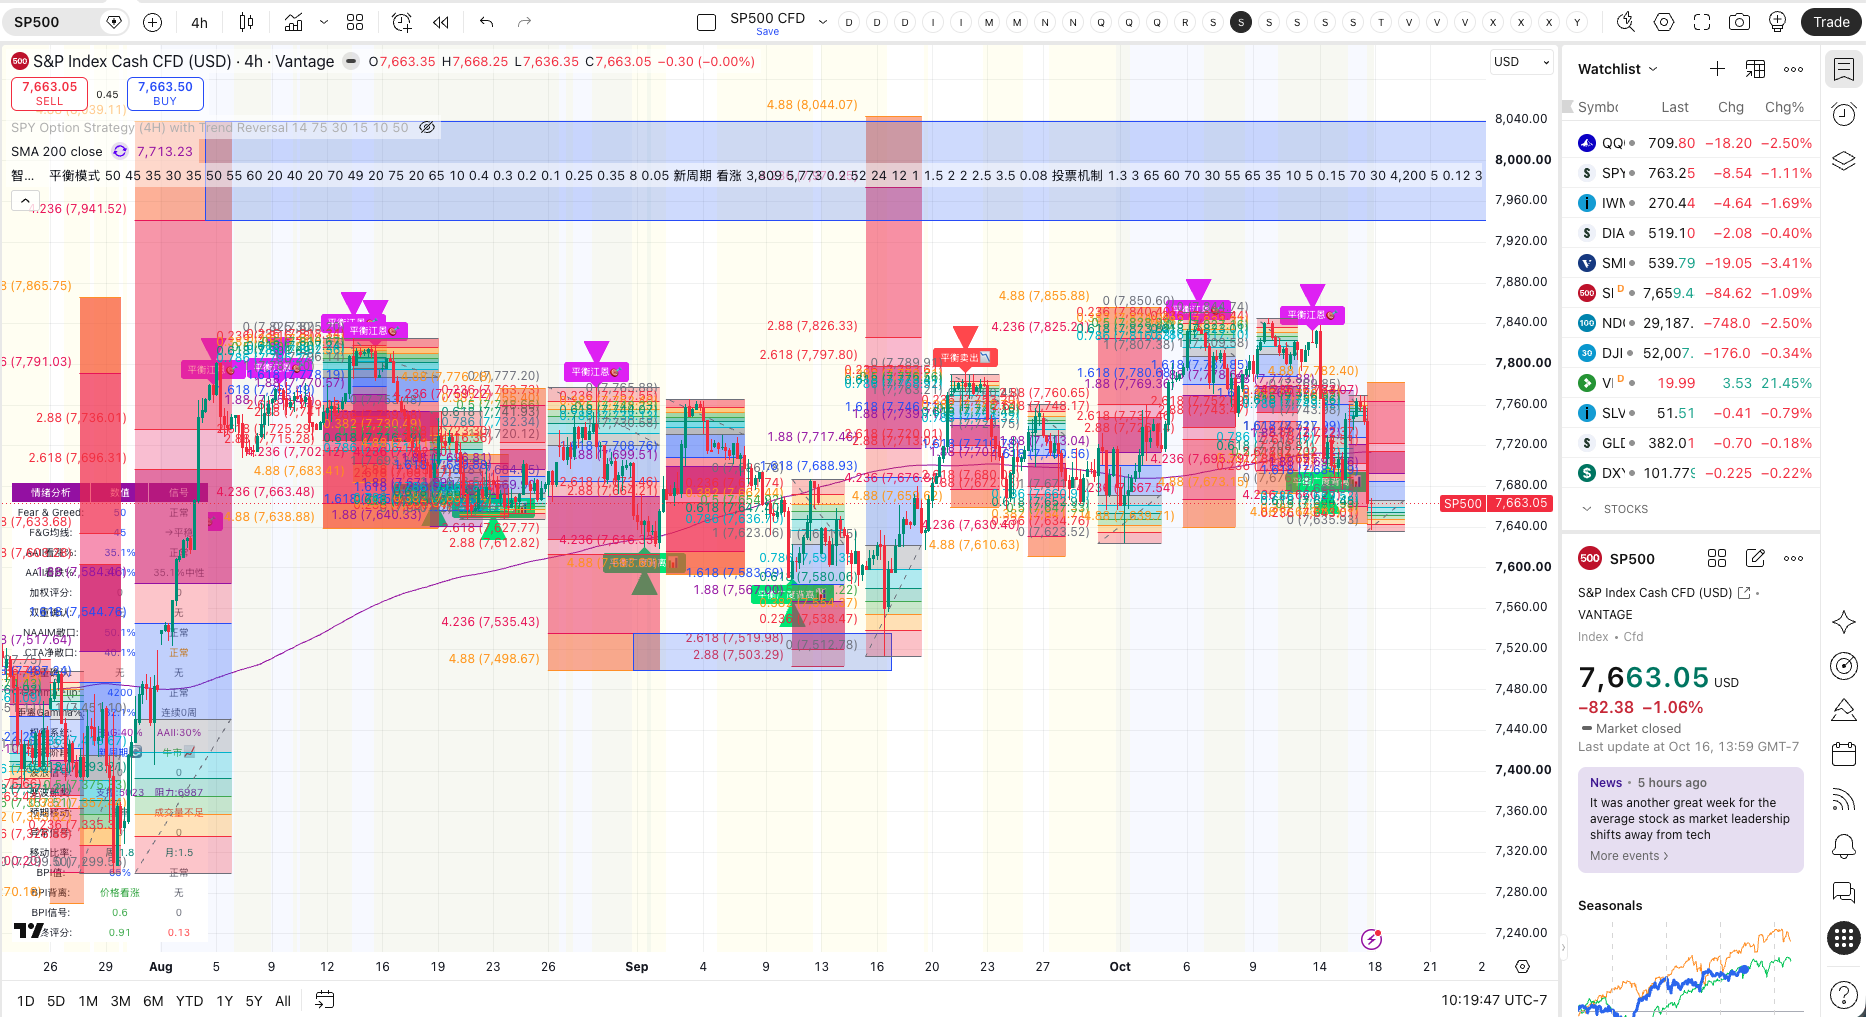 Unlike Nasdaq, S&P500 hasn't arrived at the major TP3 target area yet. This (discrepancy between Nasdaq & S&P 500) has happened before and the TLDR is that this current pullback won't breach 7300 but it could pretend to reach down to that area, threaten the livelihood of our major bullish signal but then give up and reverse.
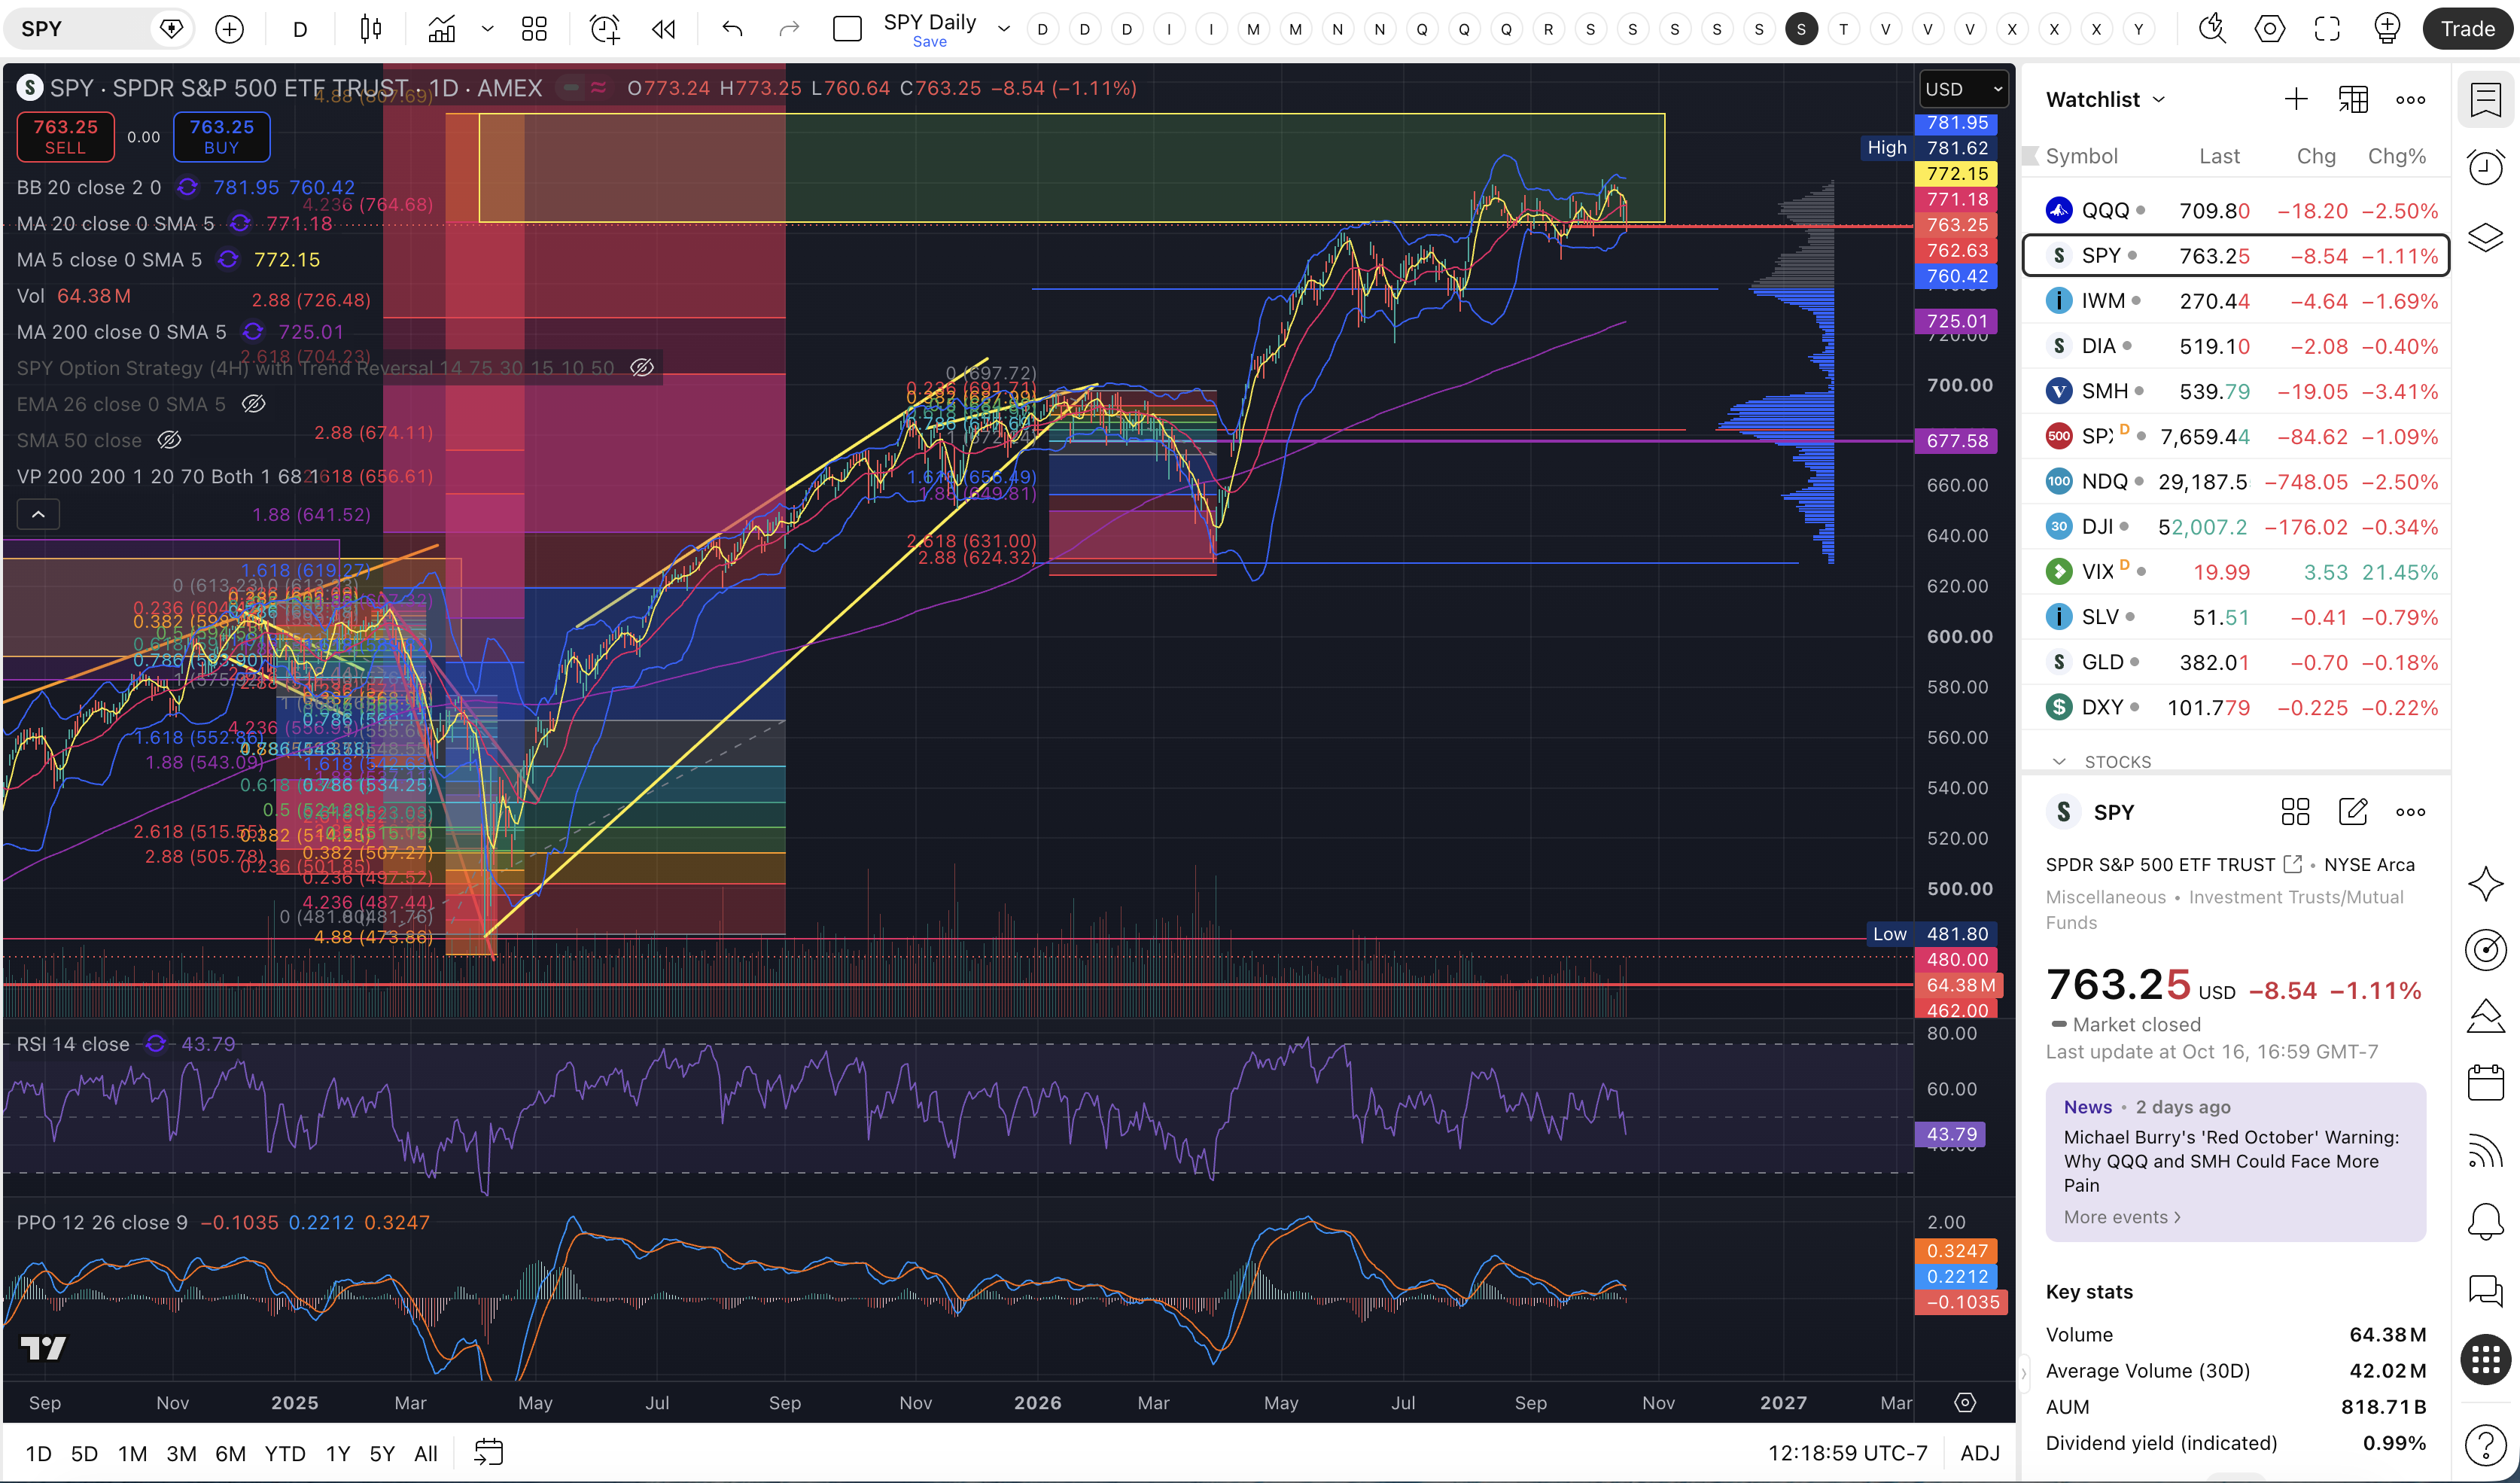 This current correction happens due to the fact that we've completed major daily bullish signal, which was initiated during tariff war in 2025. However, since S&P 500 mostly track weekly bullish signal for an entire major bull run, we still have upside target for 2027 and current pullback is not the end of it.
On Friday session (especially last 10 minutes), bulls managed to push price up and avoid the creation of daily major bearish signal like QQQ did last Wednesday. However, I do believe that it will be triggered sooner or later.
Russell 2000
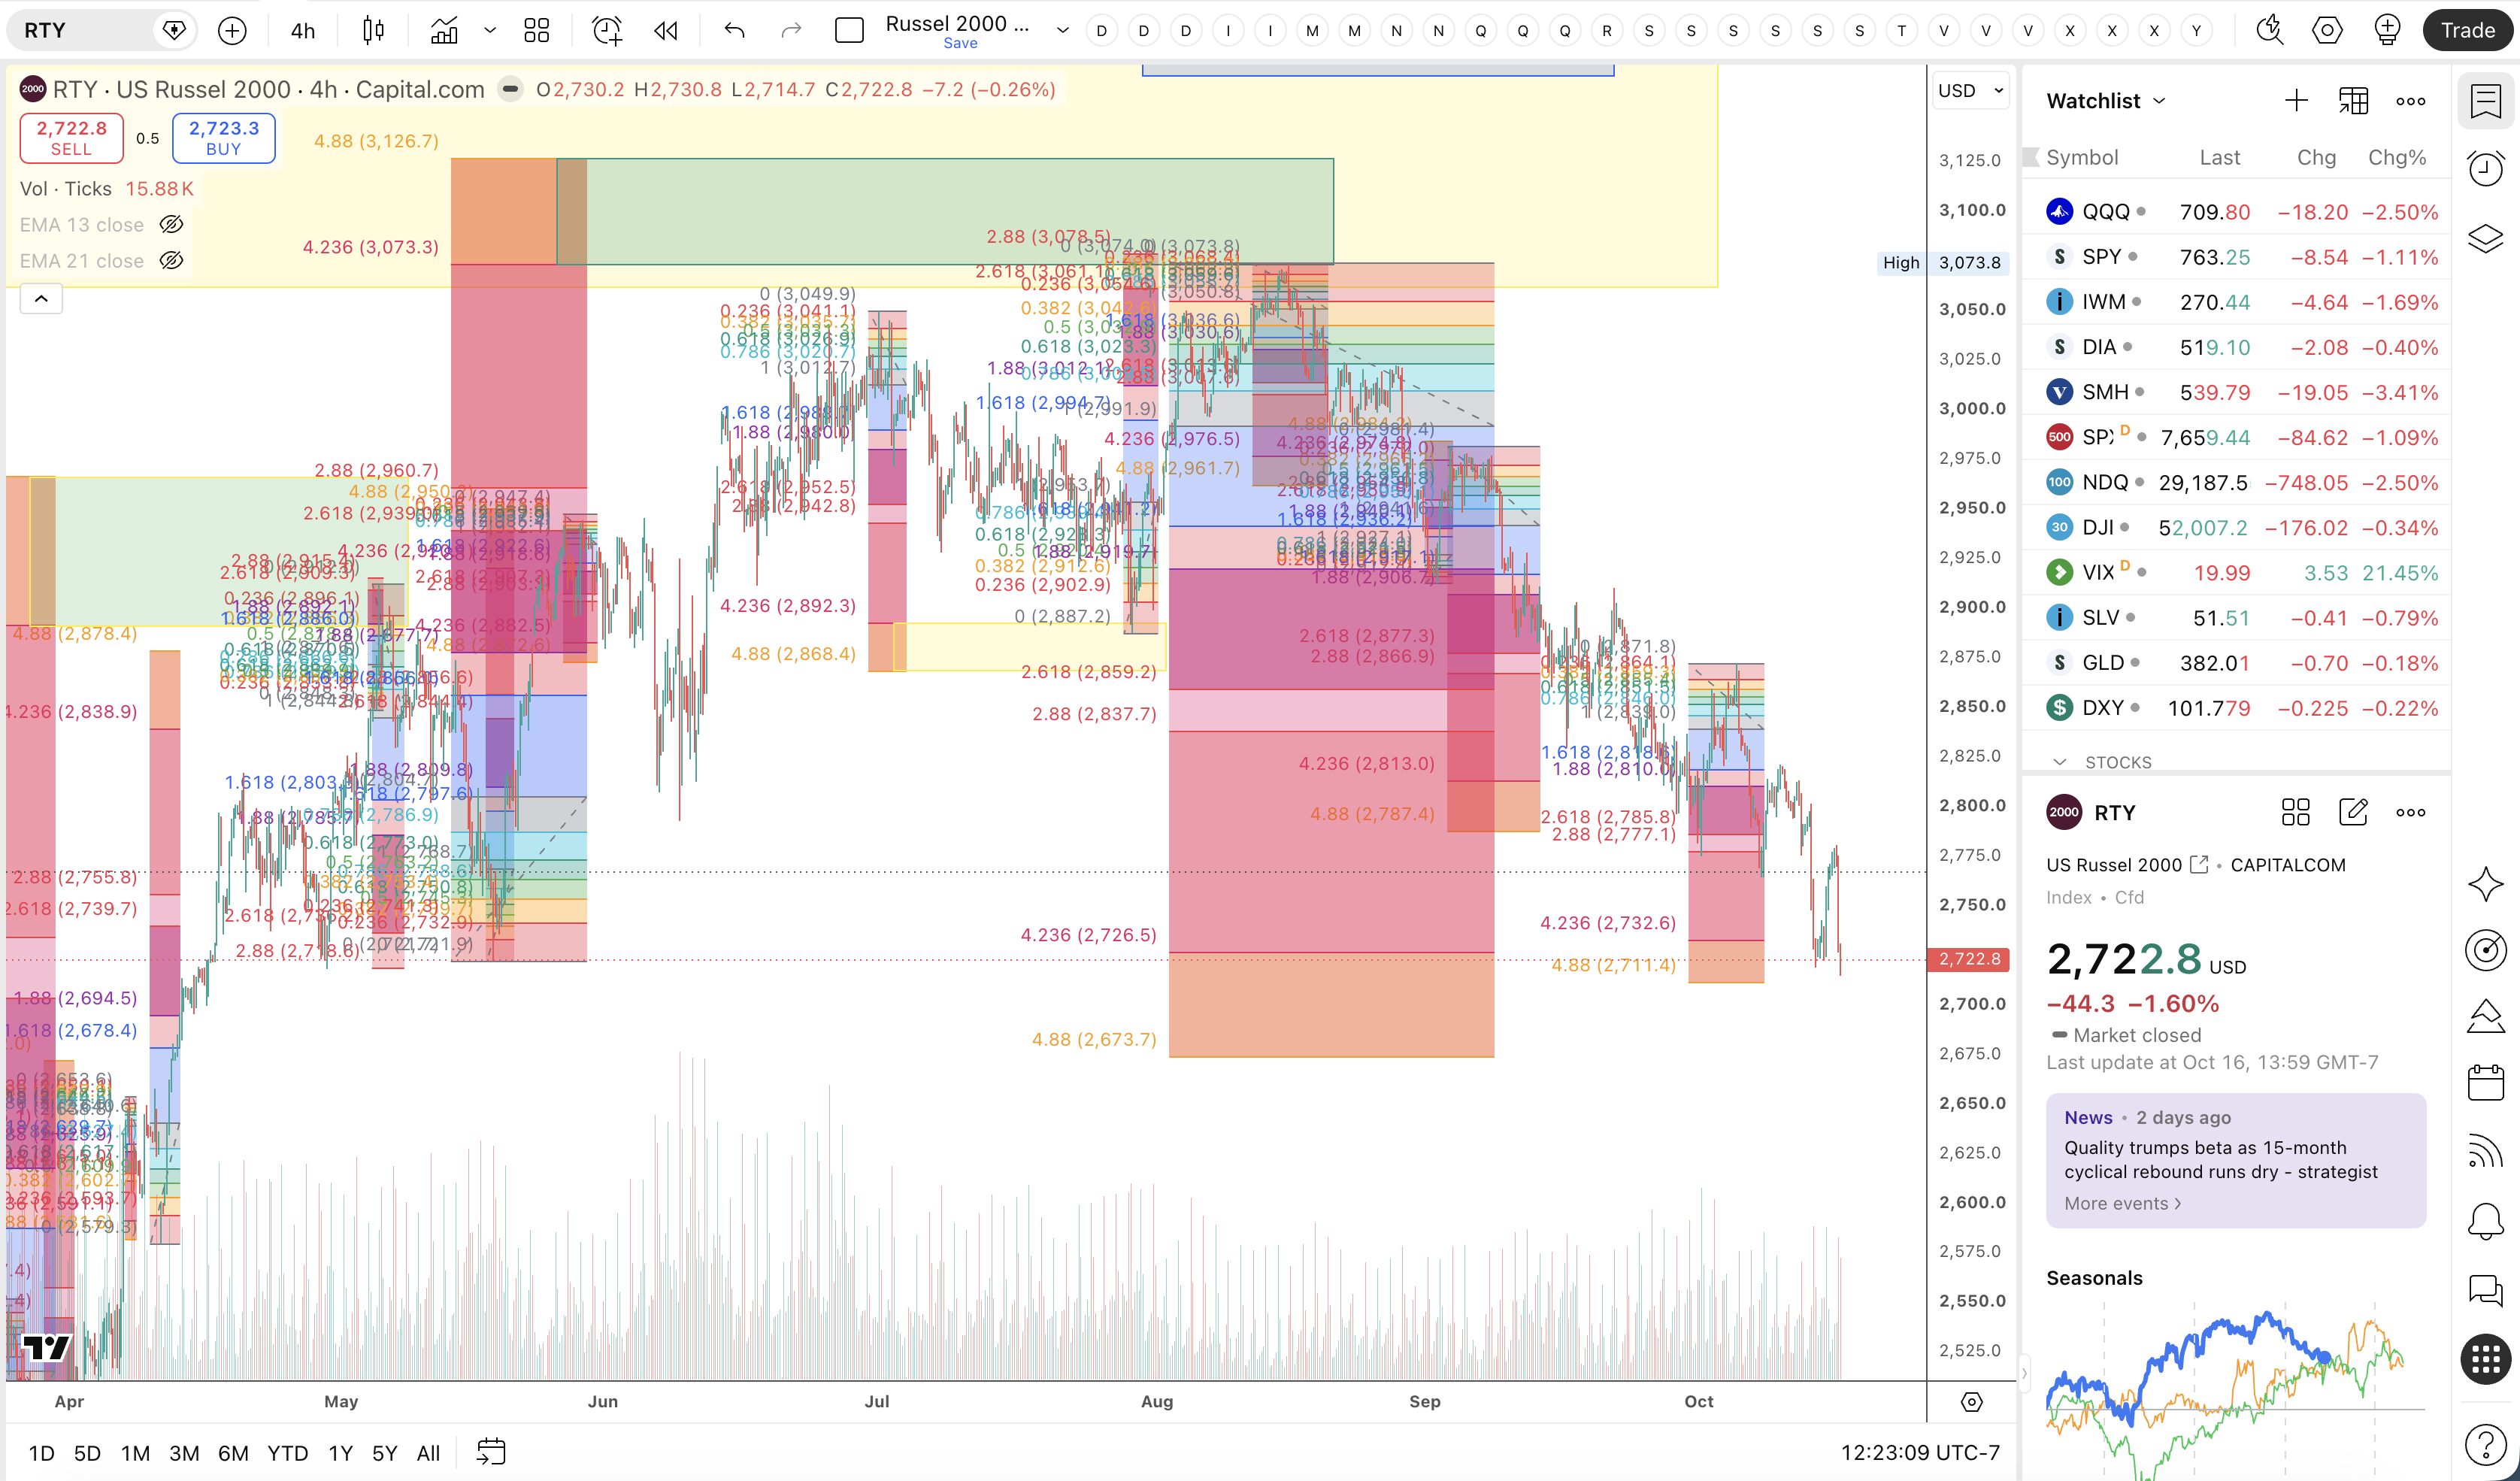 Russell 2000 peaked earlier in Aug after finished major 4h & weekly targets and has since then steadily moved down. Now we are at daily & 4h bearish TP3, which should be an important temporary bottoming area for at least a multi-day bounce.
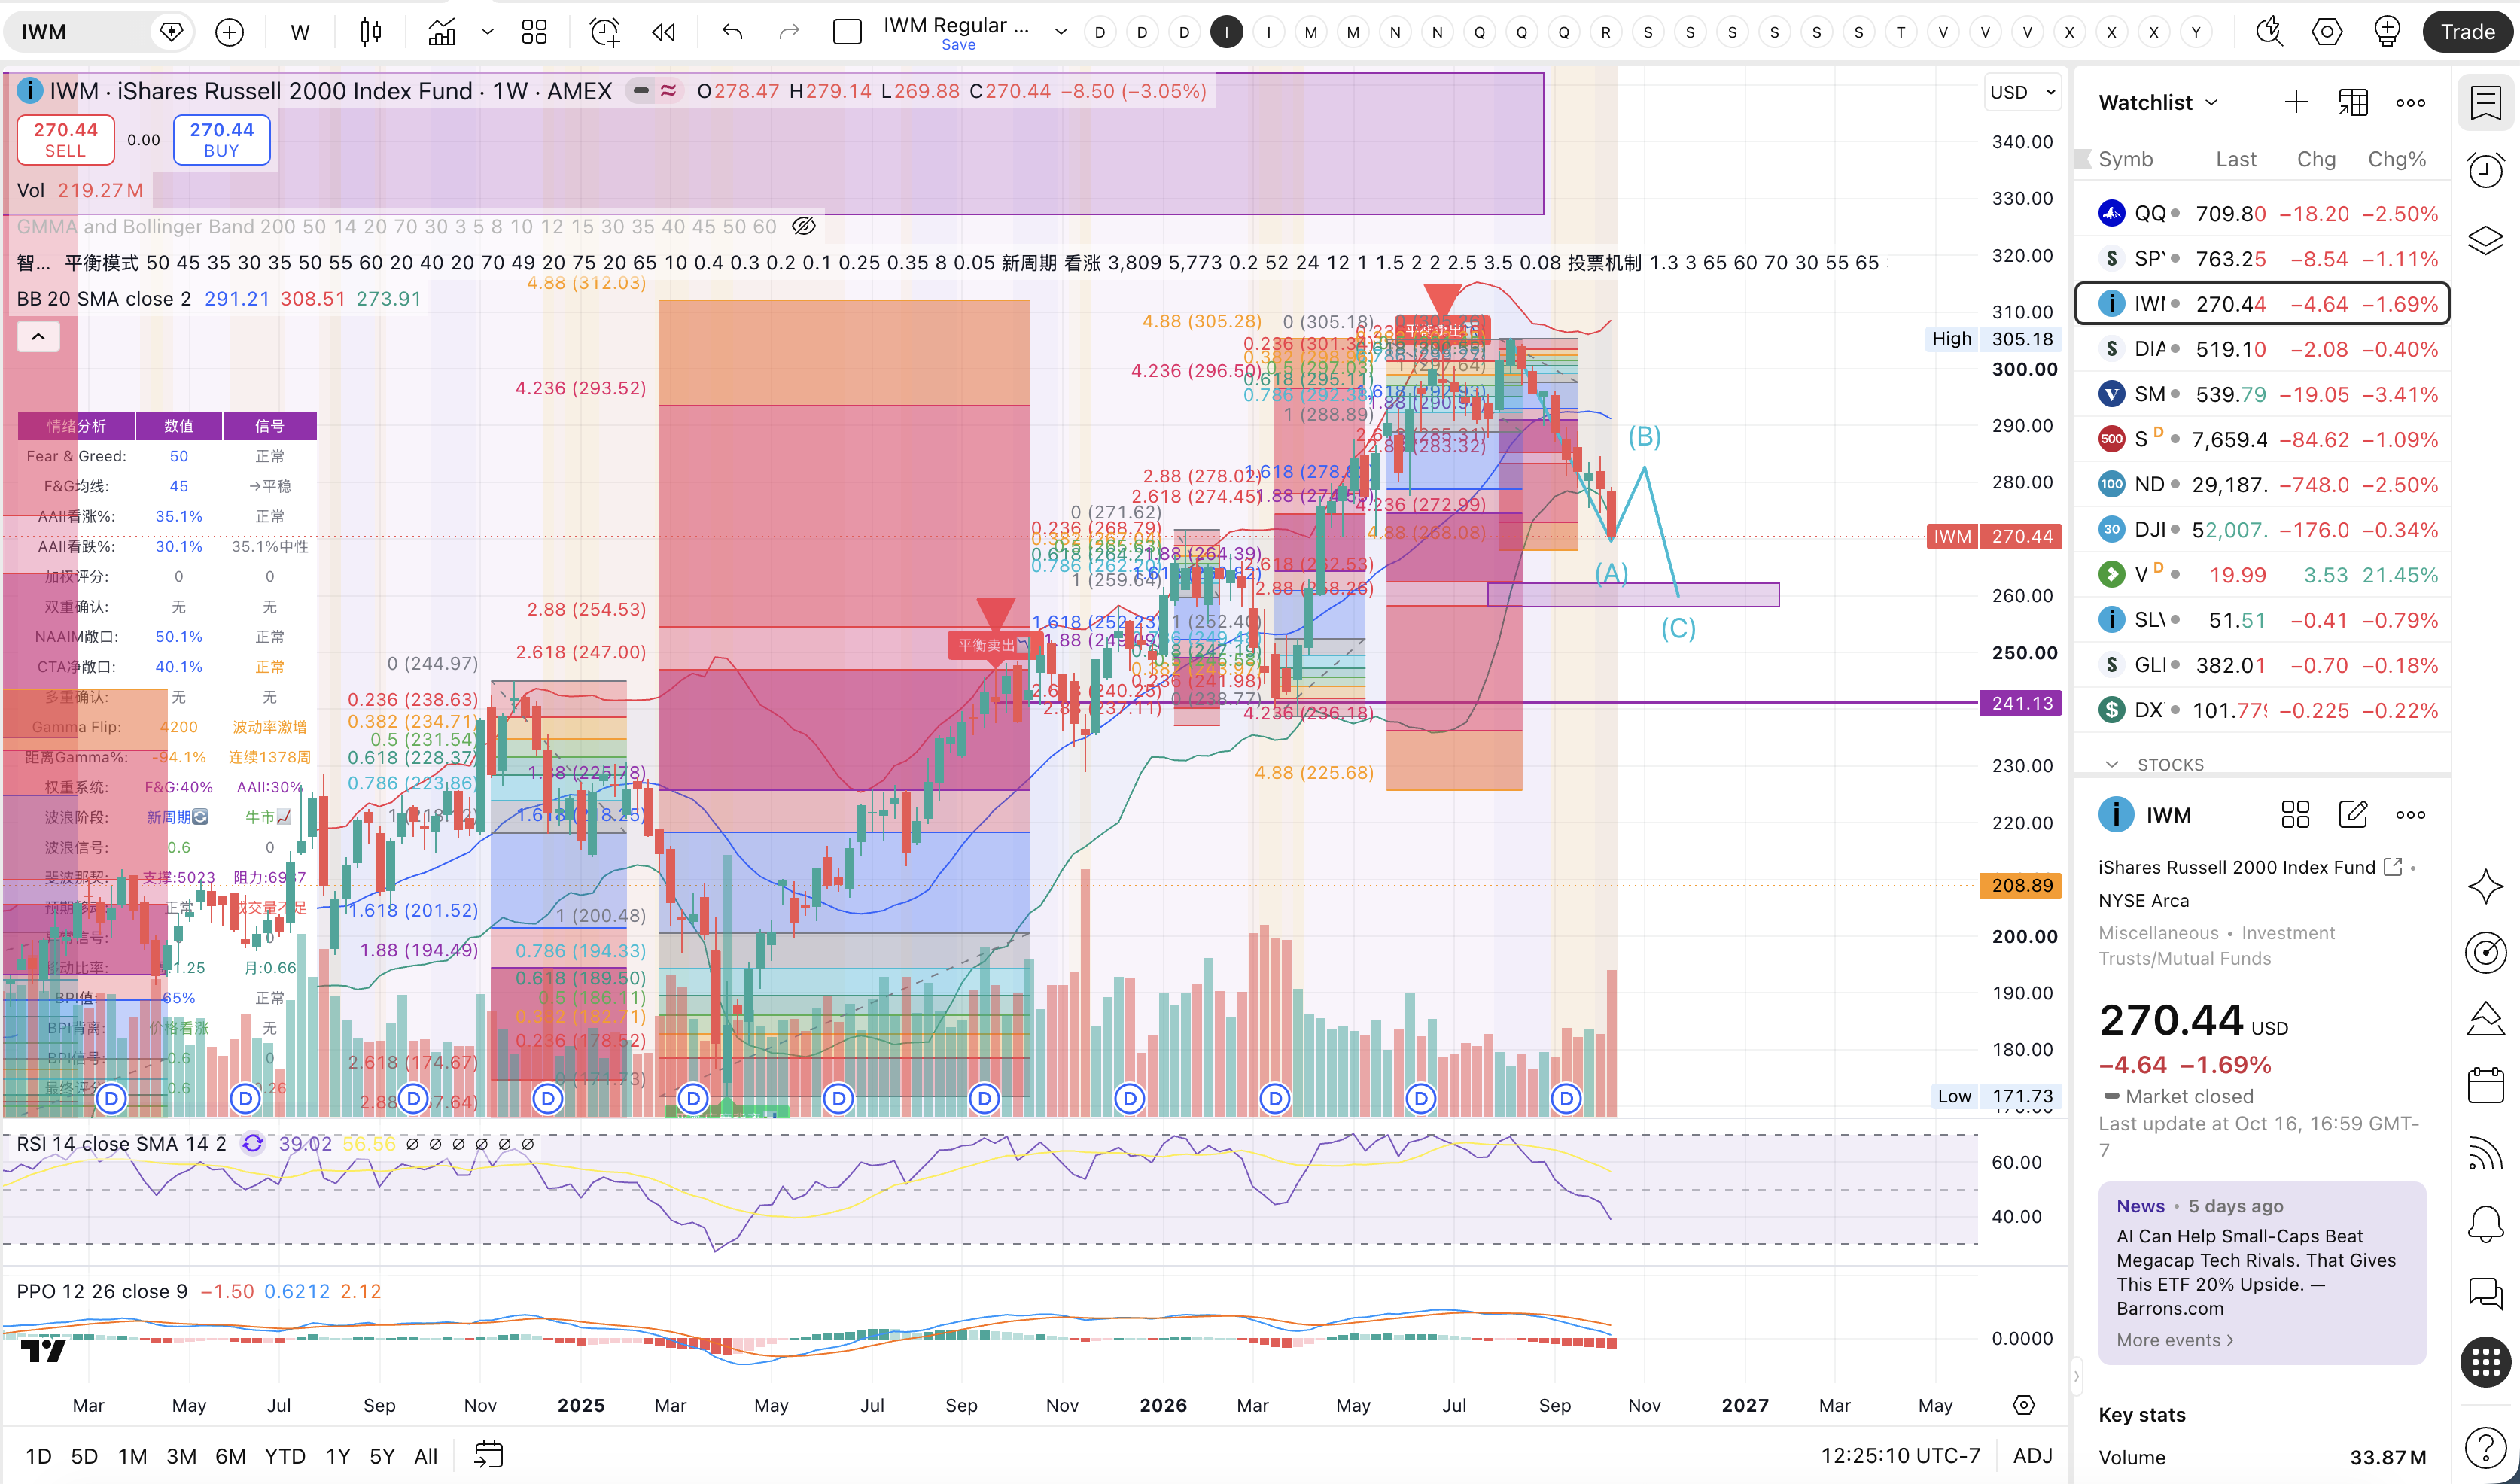 IWM is also out of bottom Bollinger band currently just like QQQ, and I expect it to bounce a bit then resume selloff again.
Dow Jones
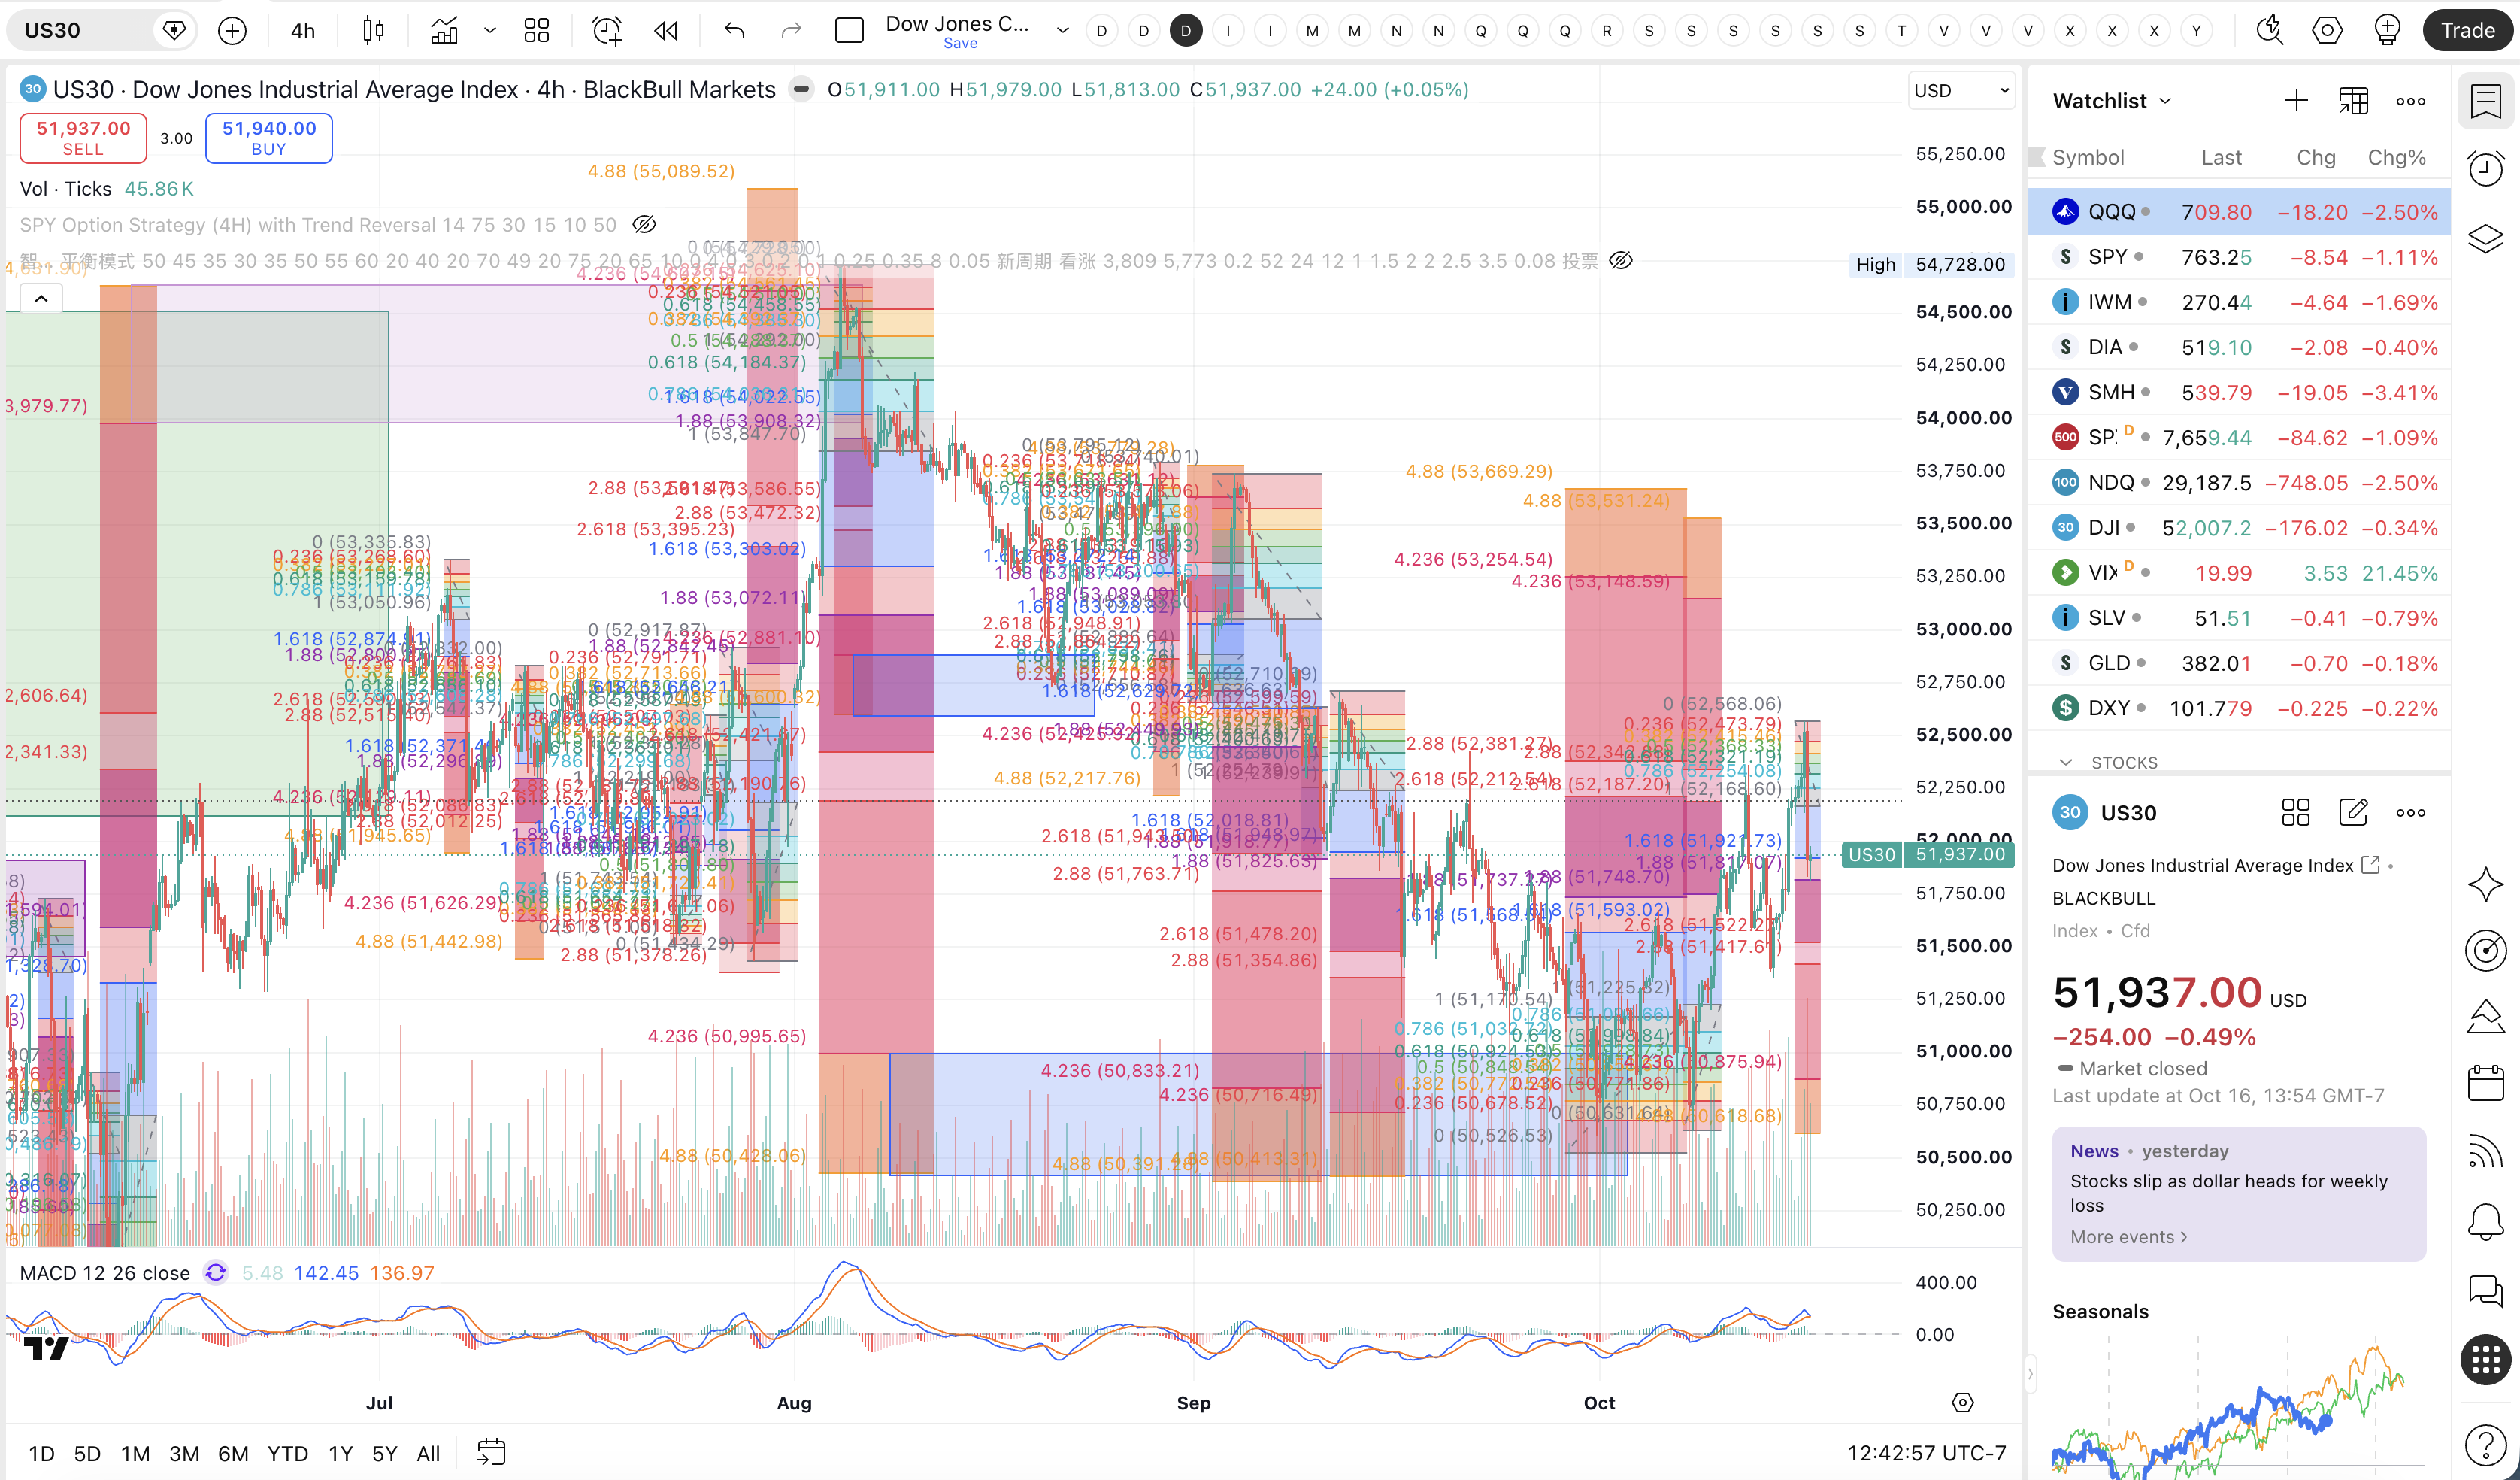 Dow Jones topped around the same time as Russell 2000, after achieving 1h & 4h major bullish signals. Unlike the other 3, it bottomed earlier this month when it completed the 4h bearish signal journey. Now it's on track to the upside target, which is the overlapping TP3 area above, but we sure are gonna see a lot of choppy bumps along the way.
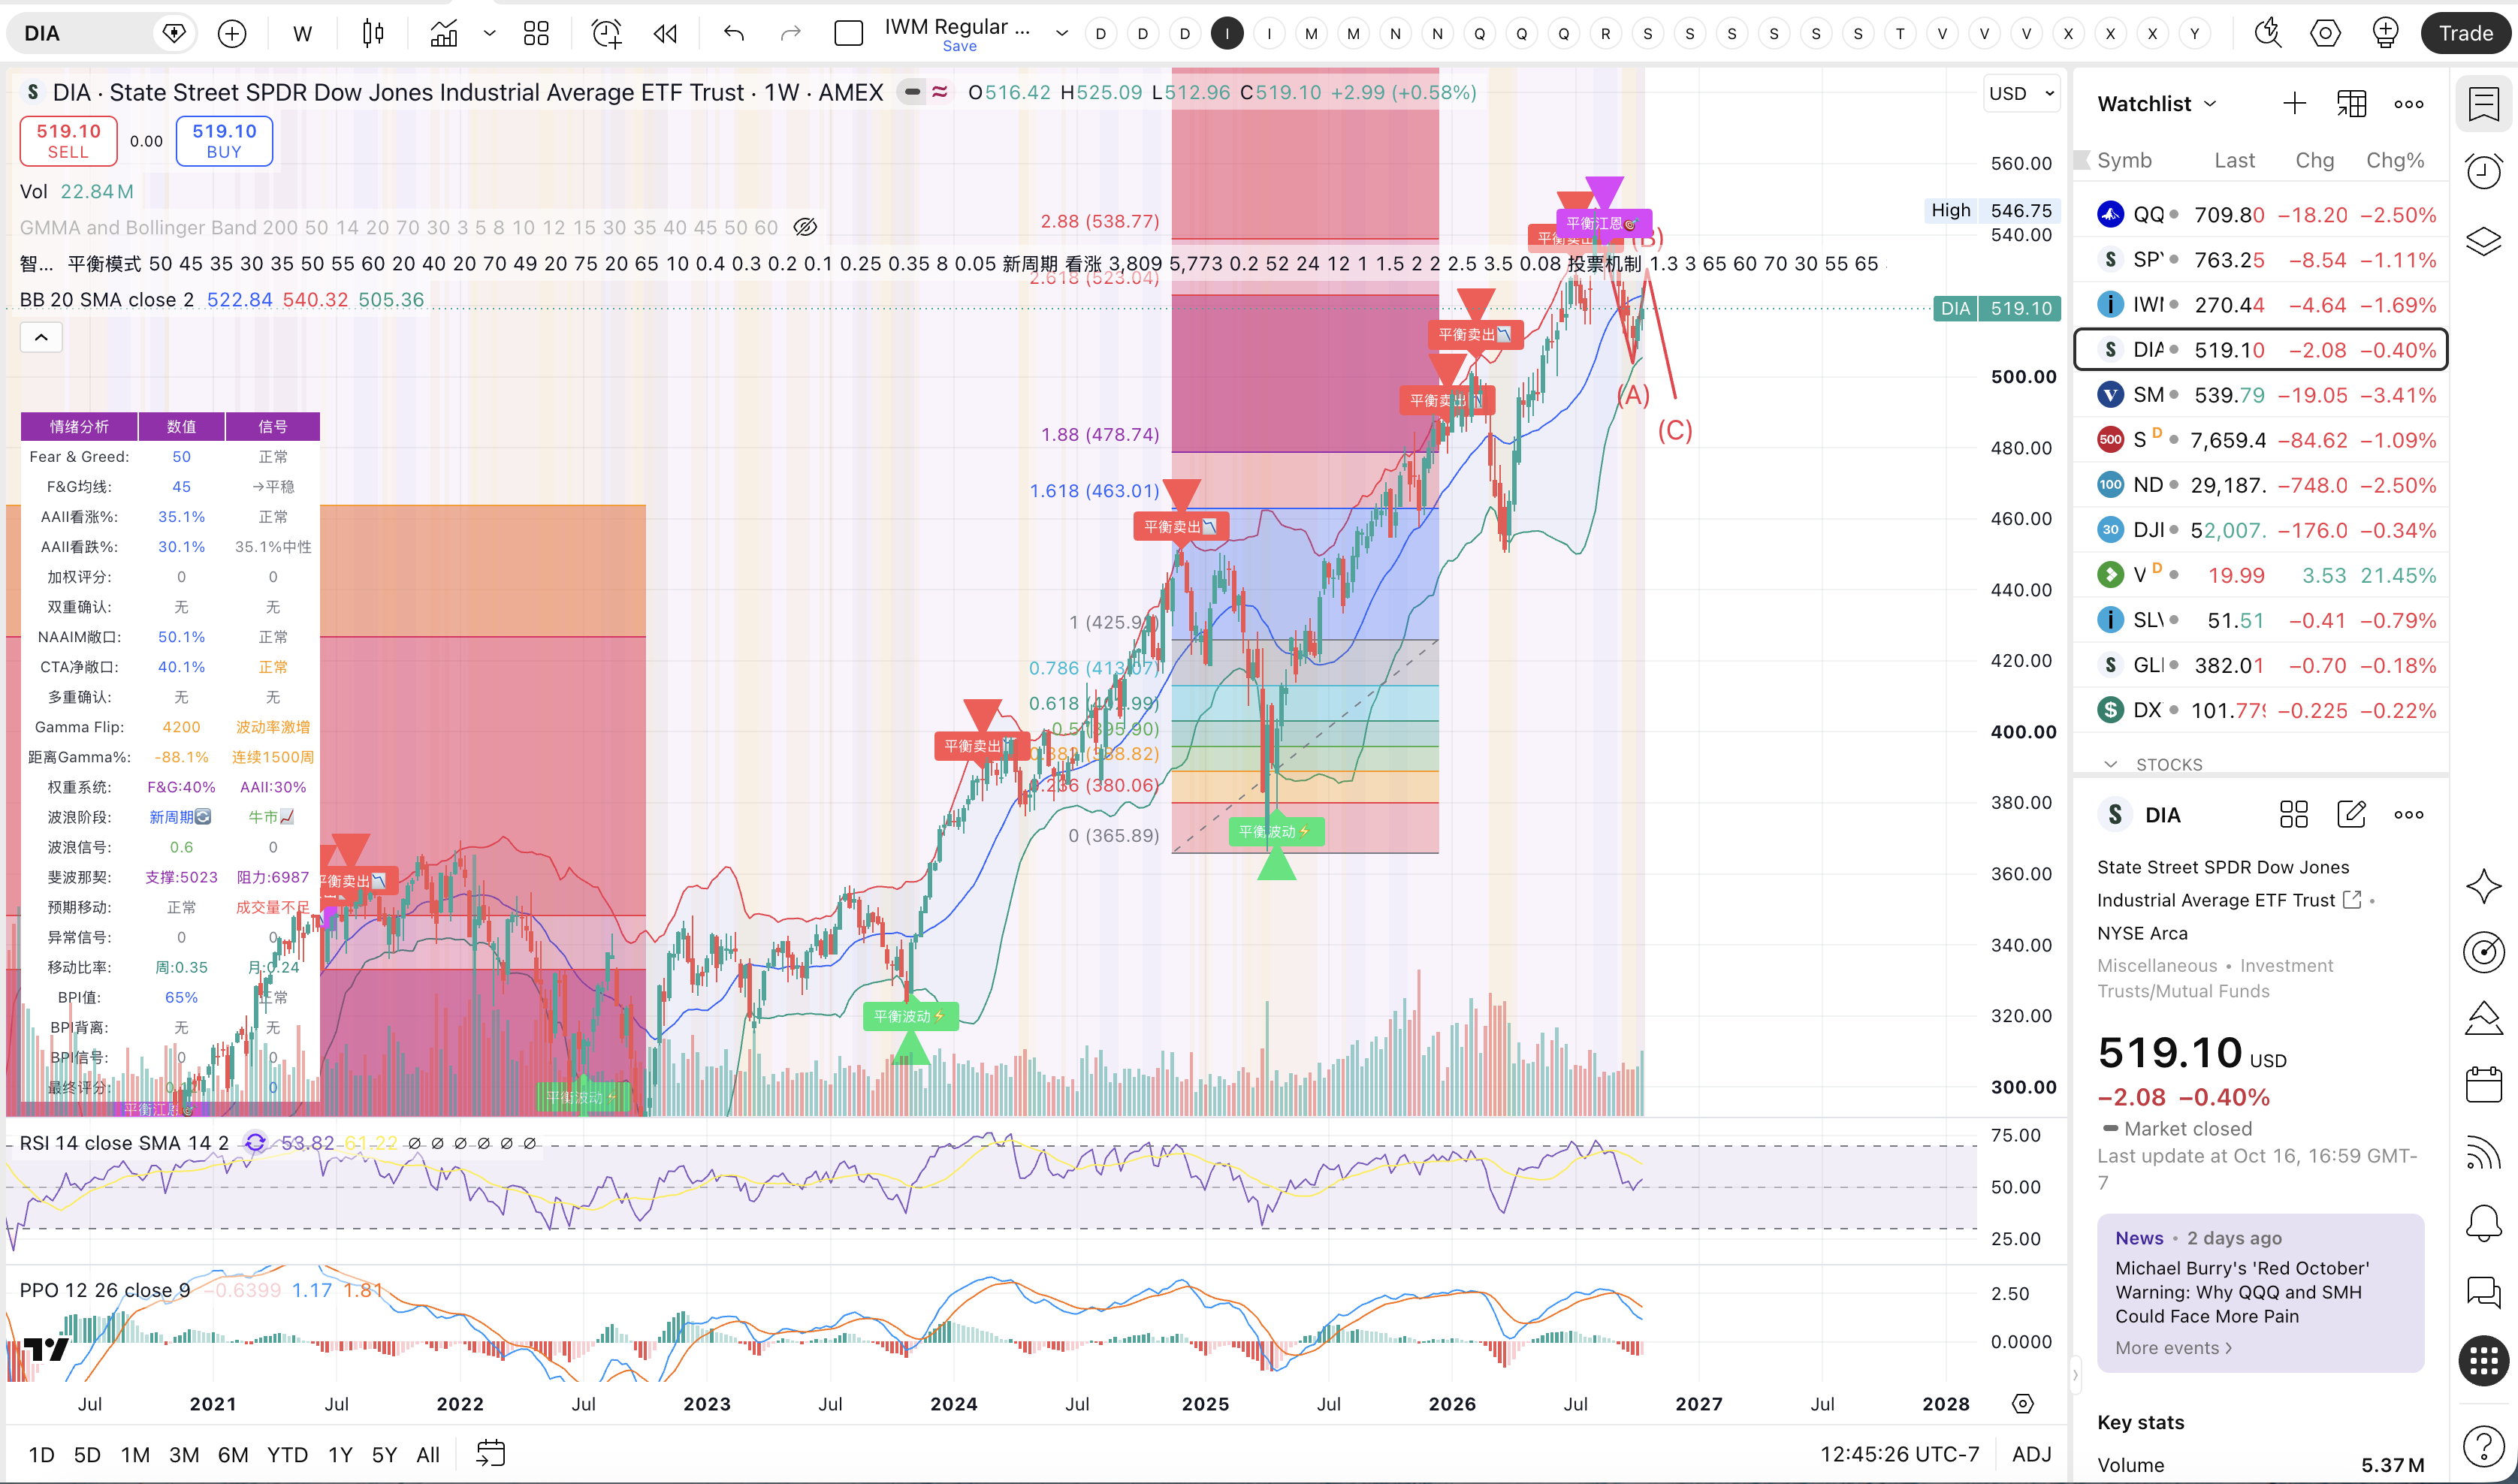 On the larger timeframe, we were just at major weekly TP2 and there's still a lot of upside room left.
Semiconductors
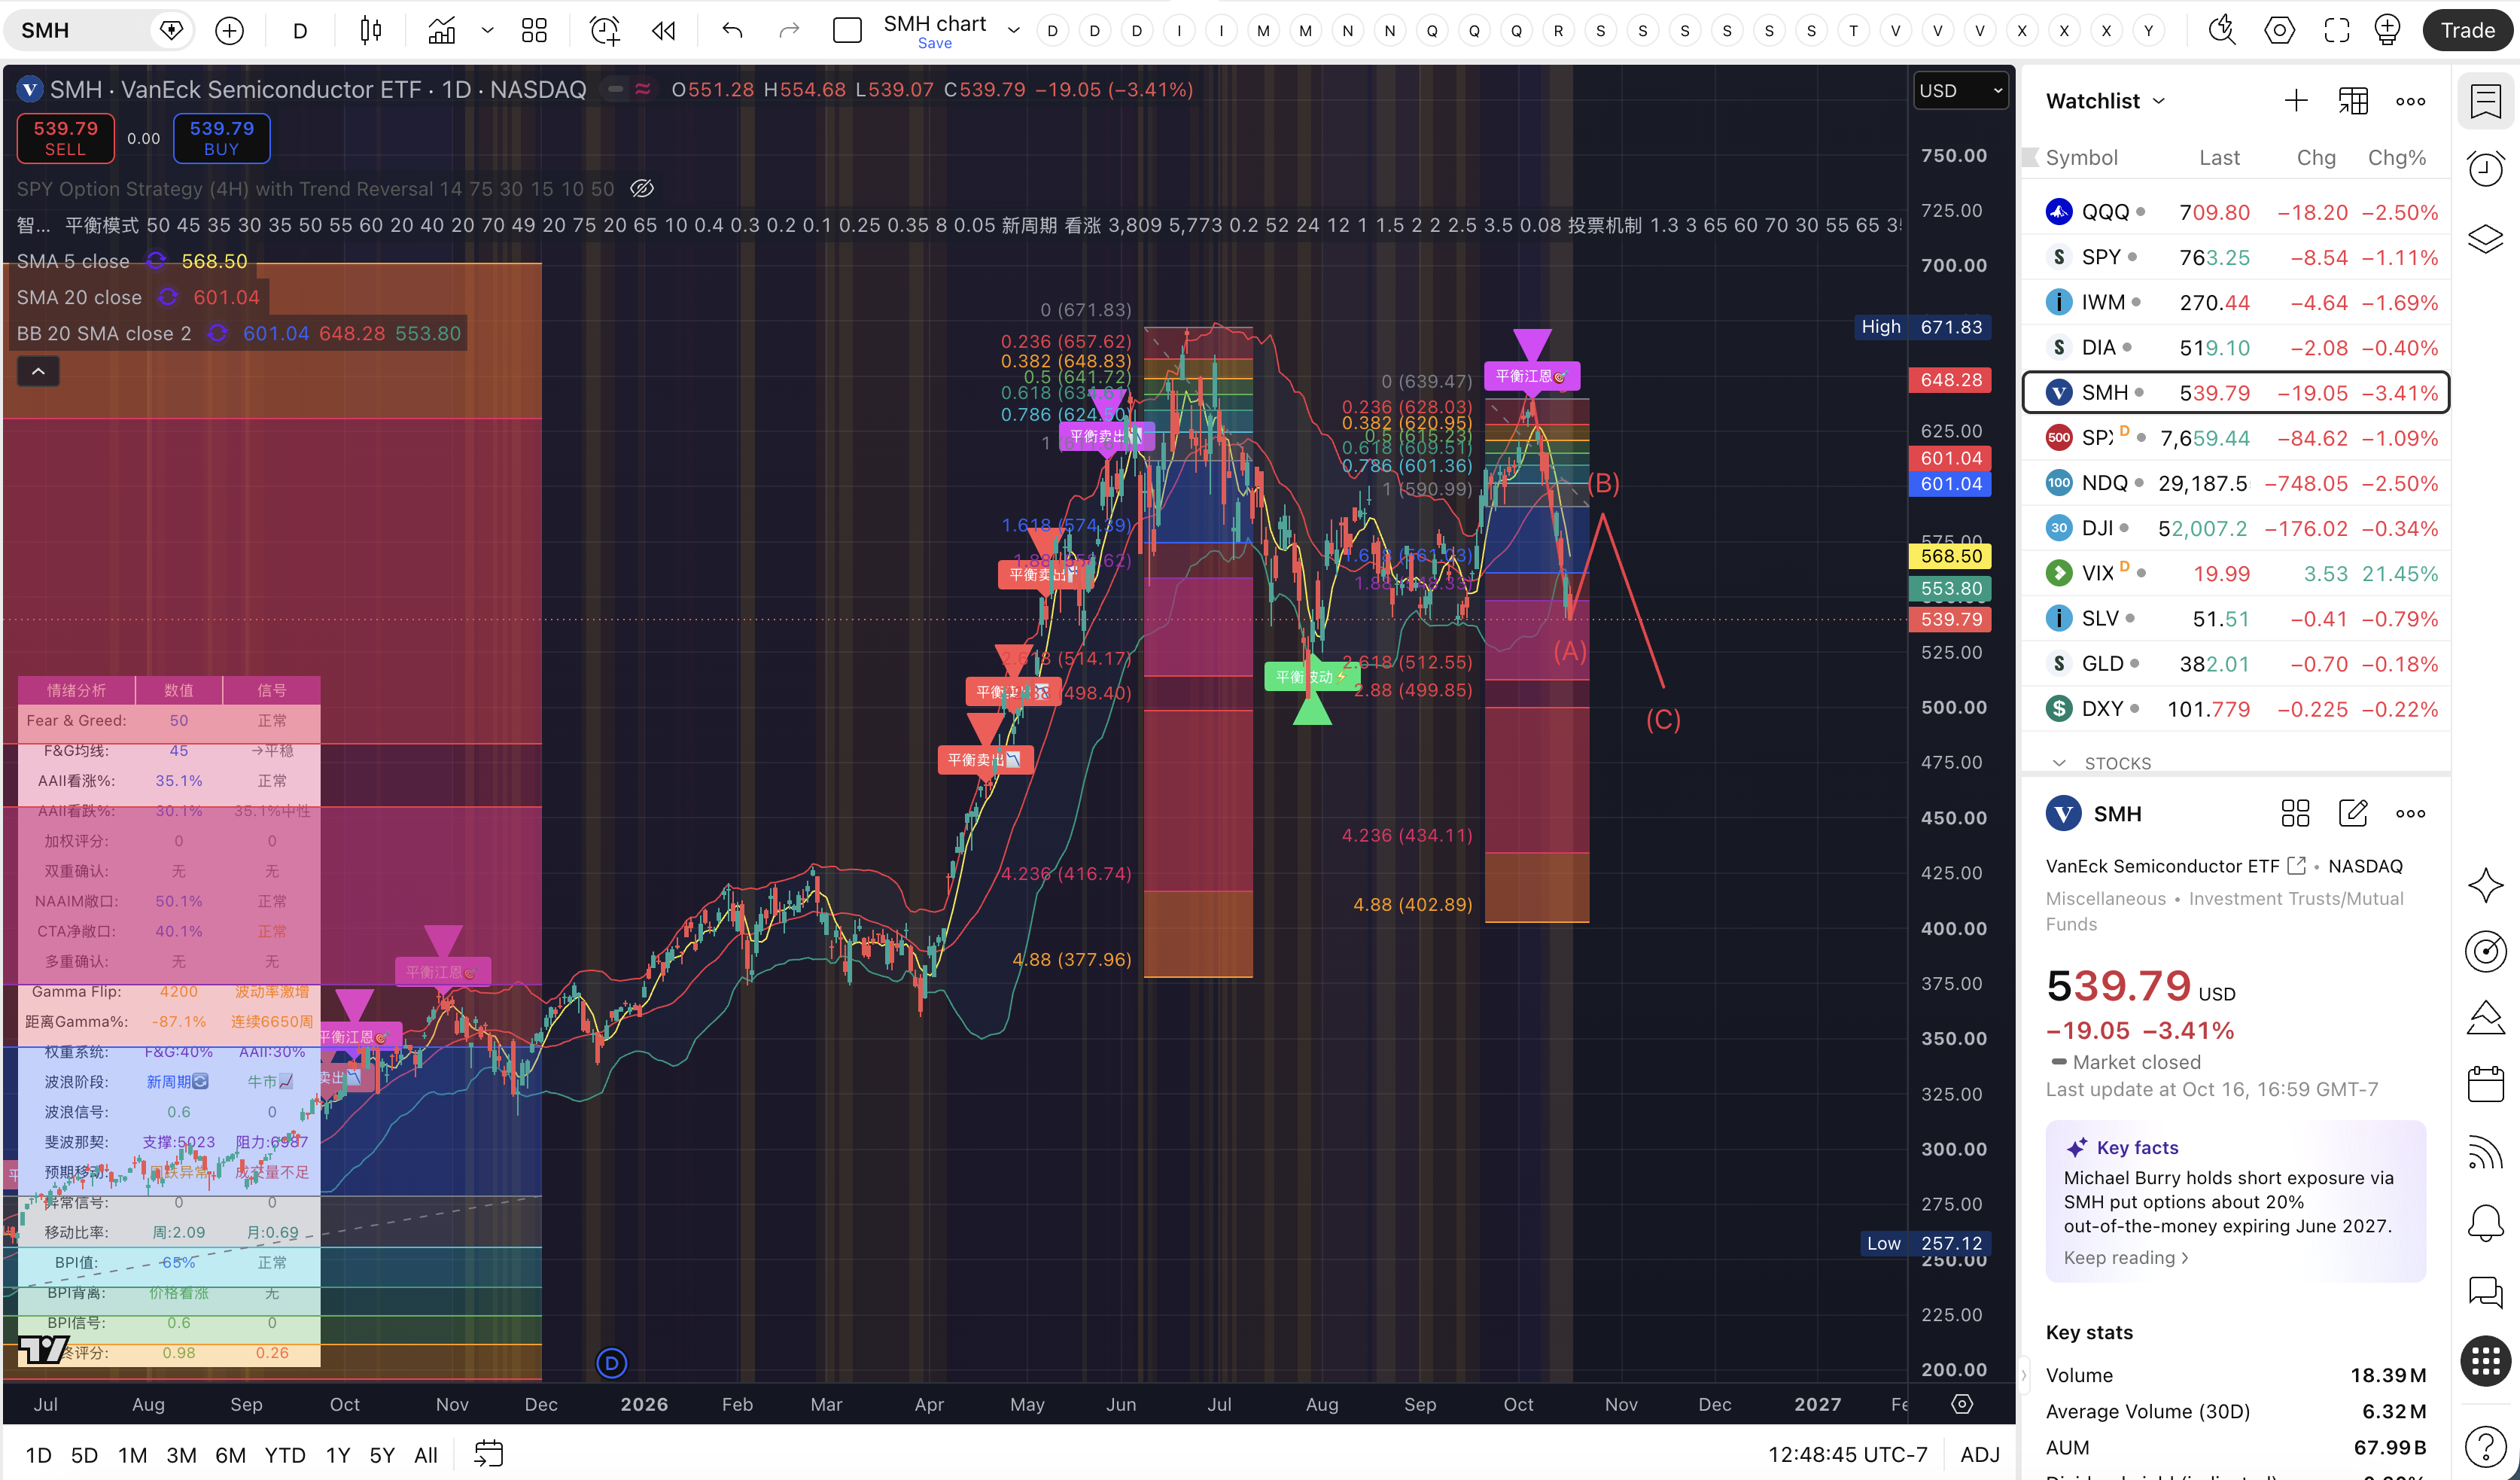 Semiconductors finished an extraordinary fly up till it reached TP3 of major monthly bullish signal.
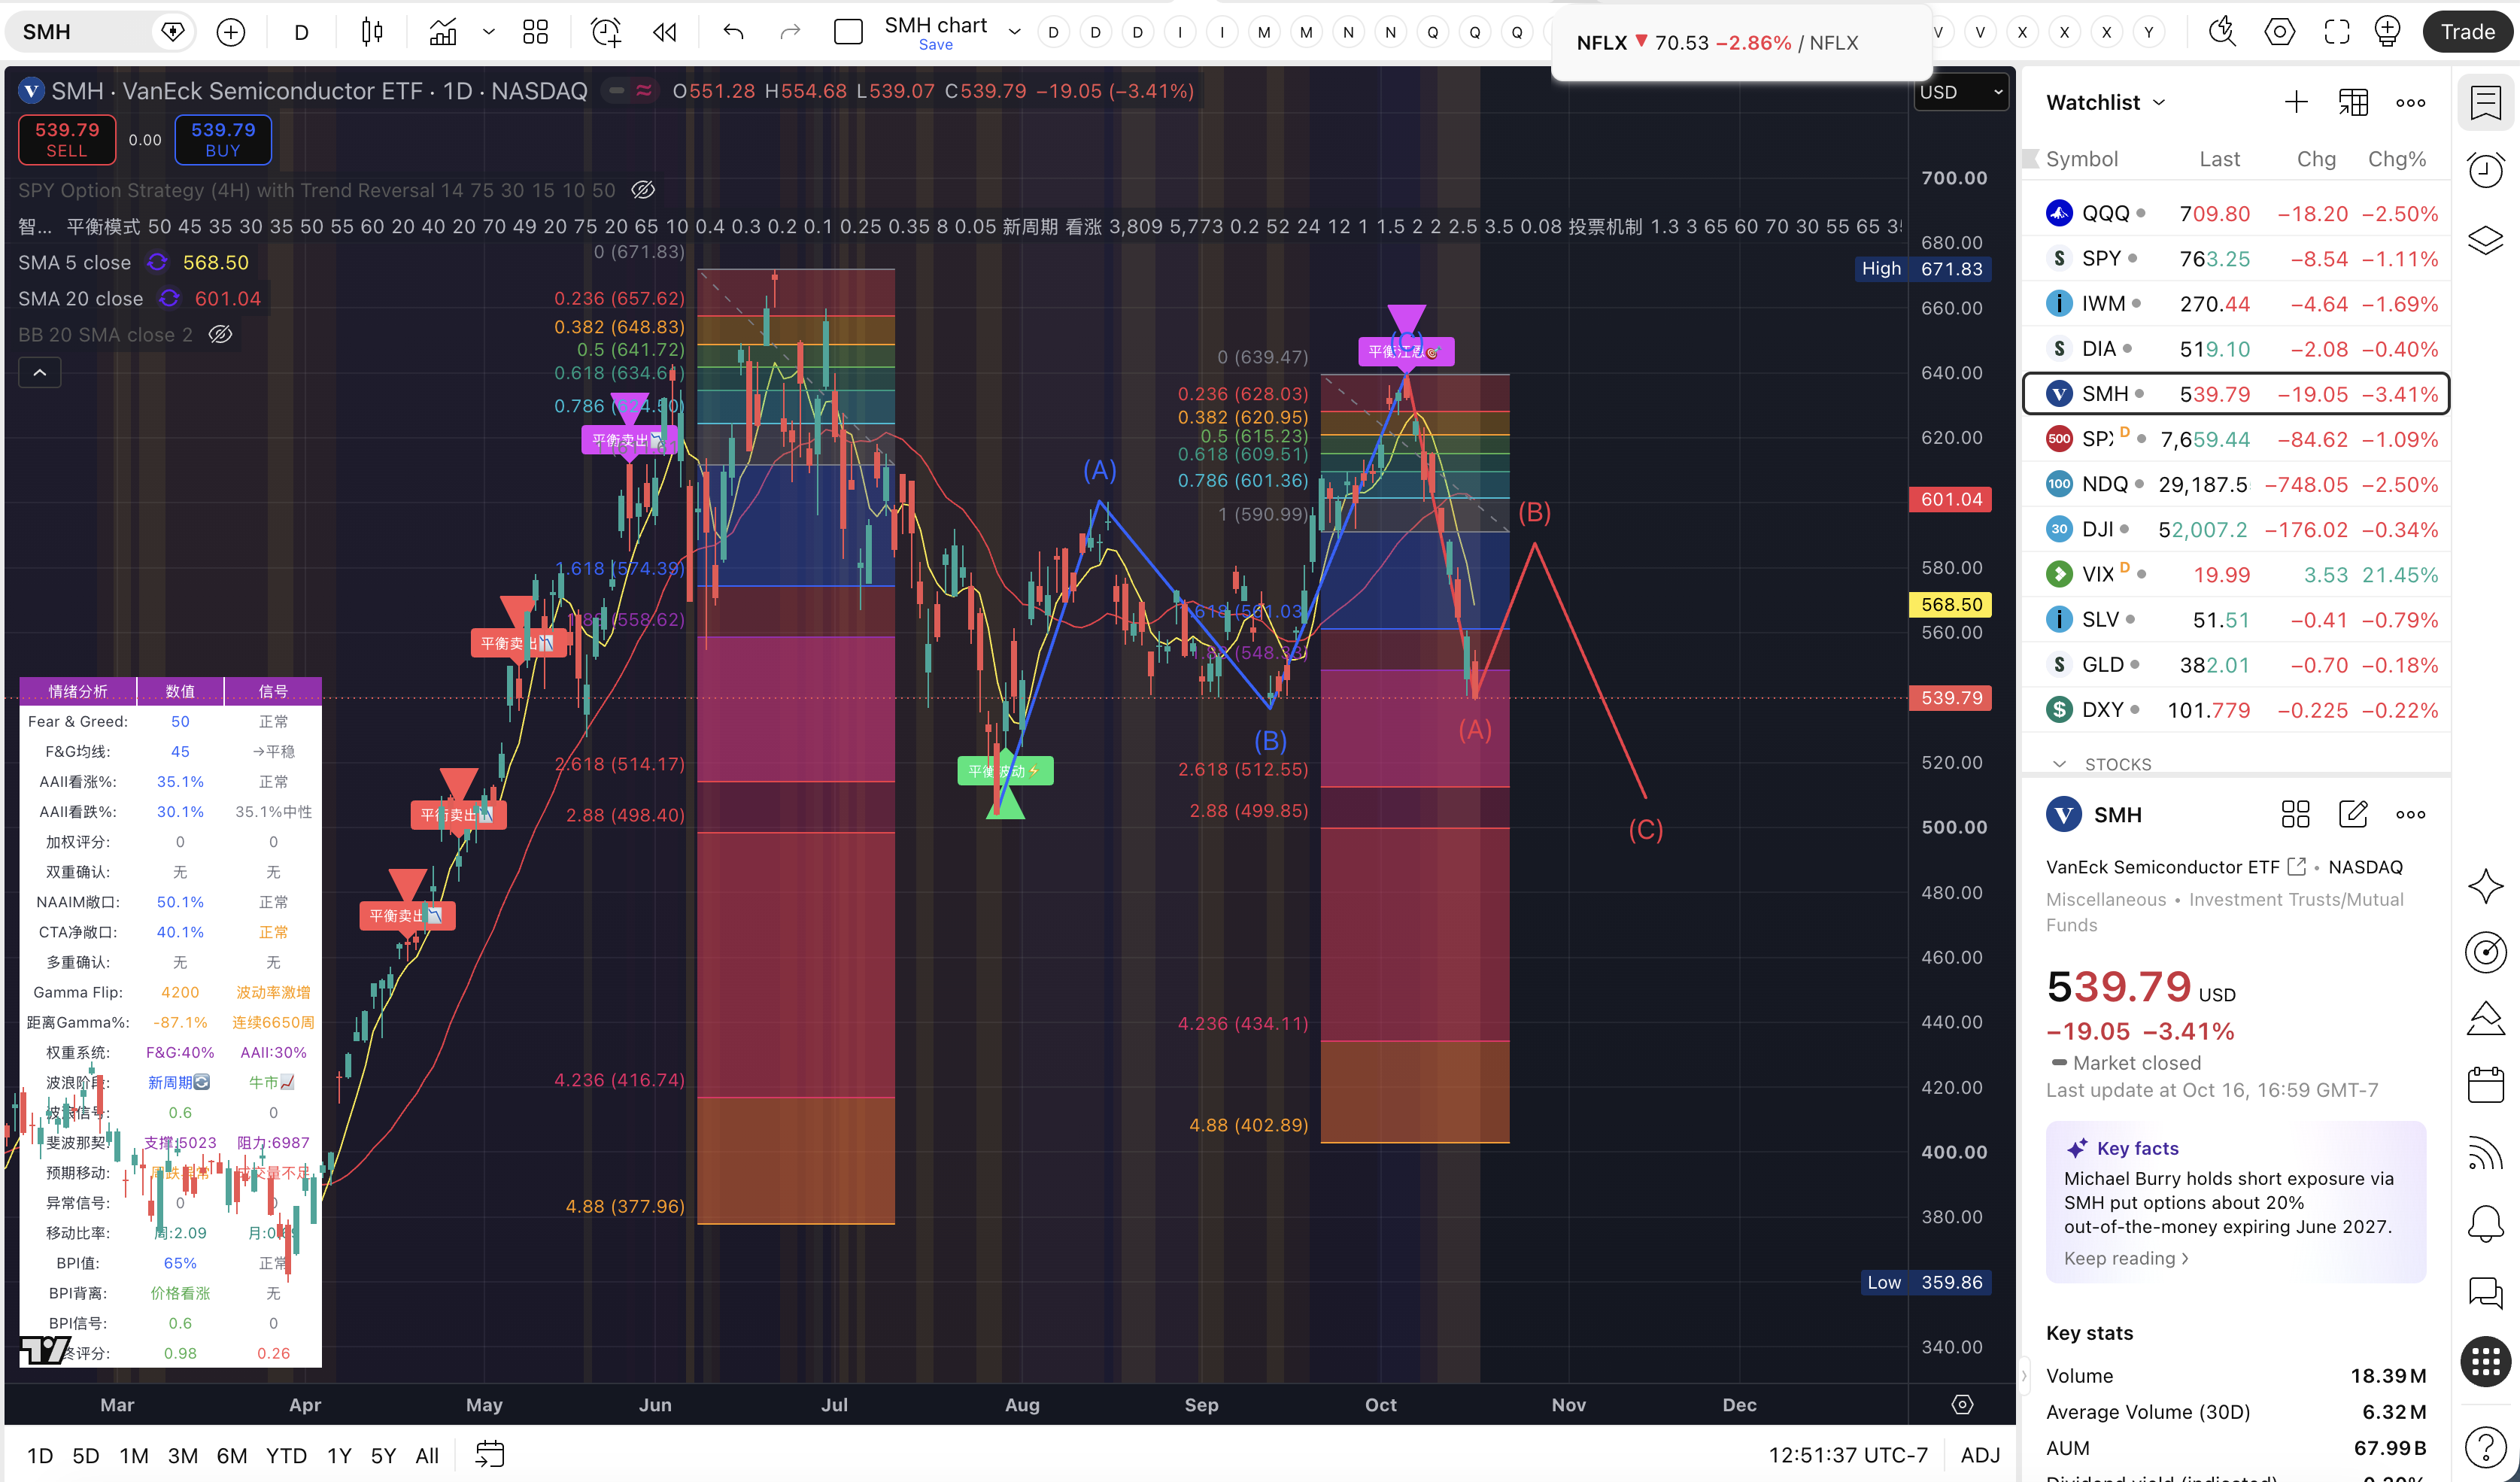 The first pullback/correction stopped right at daily TP2, made an ABC bounce, then started falling again. I'm expecting it to drop to TP2 of the new daily signal, which is also pretty close to the previous bottom.
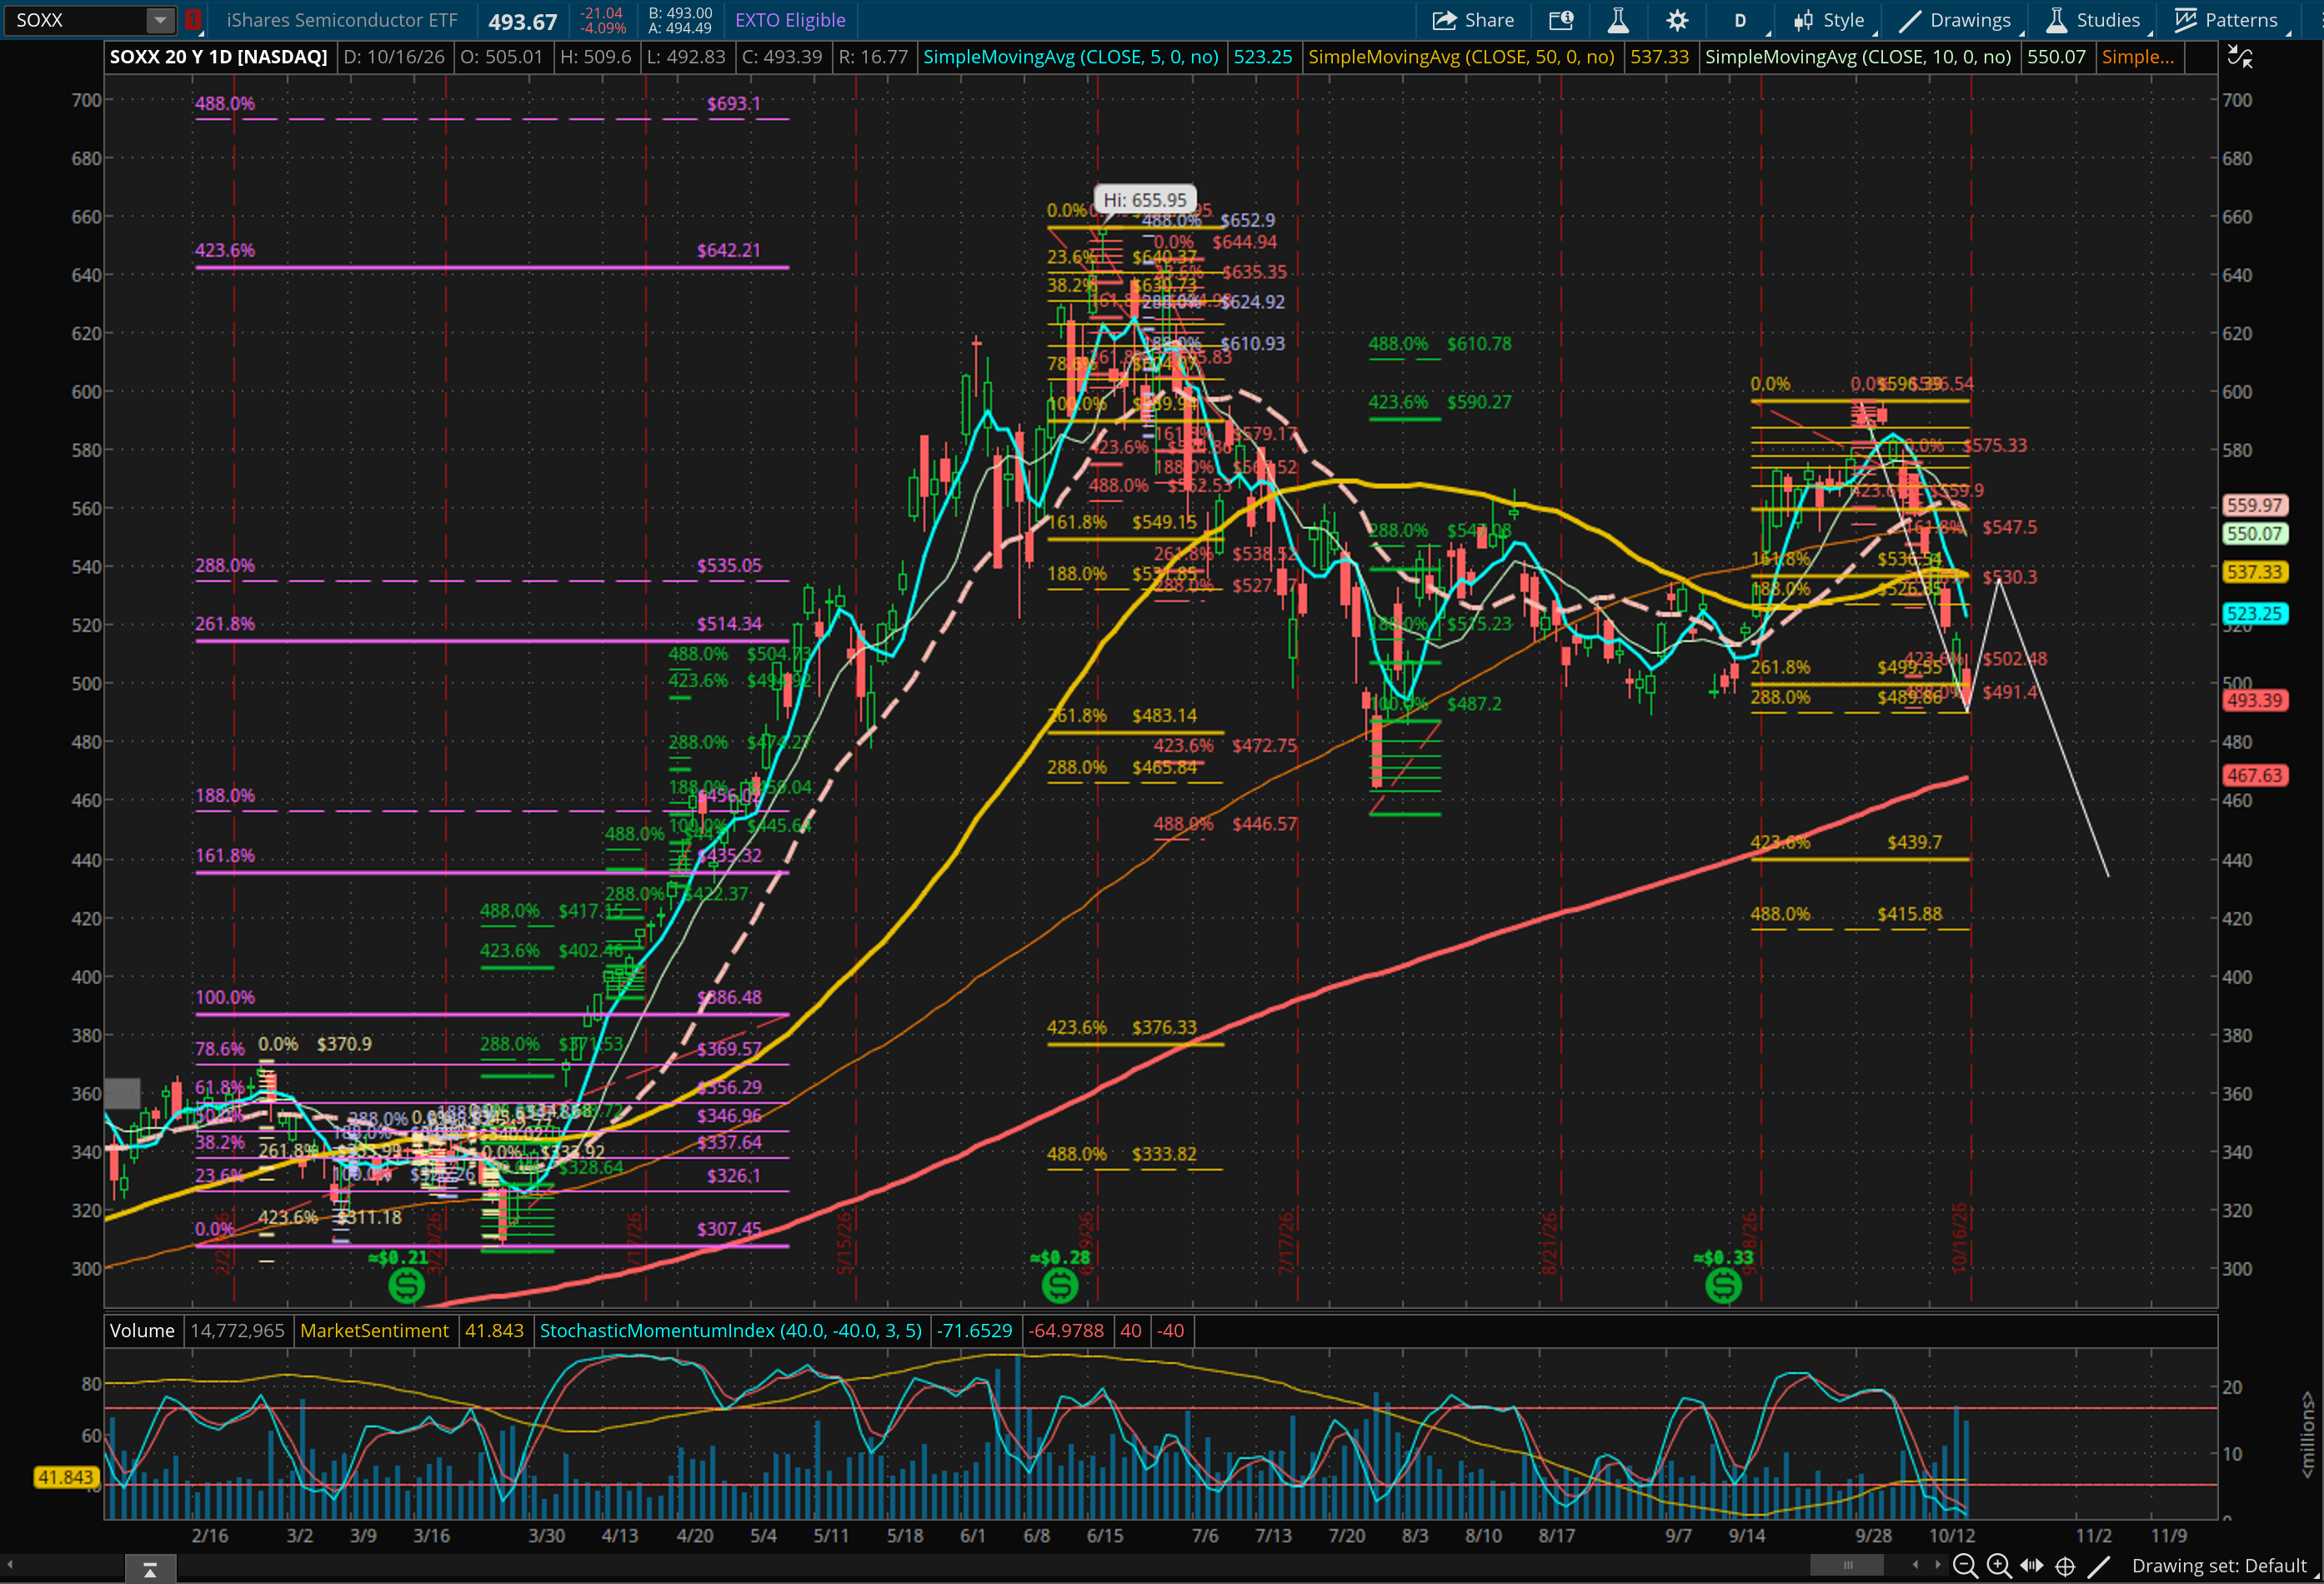 SOXX has slightly different format and price targets but generally looks very similar to SMH.
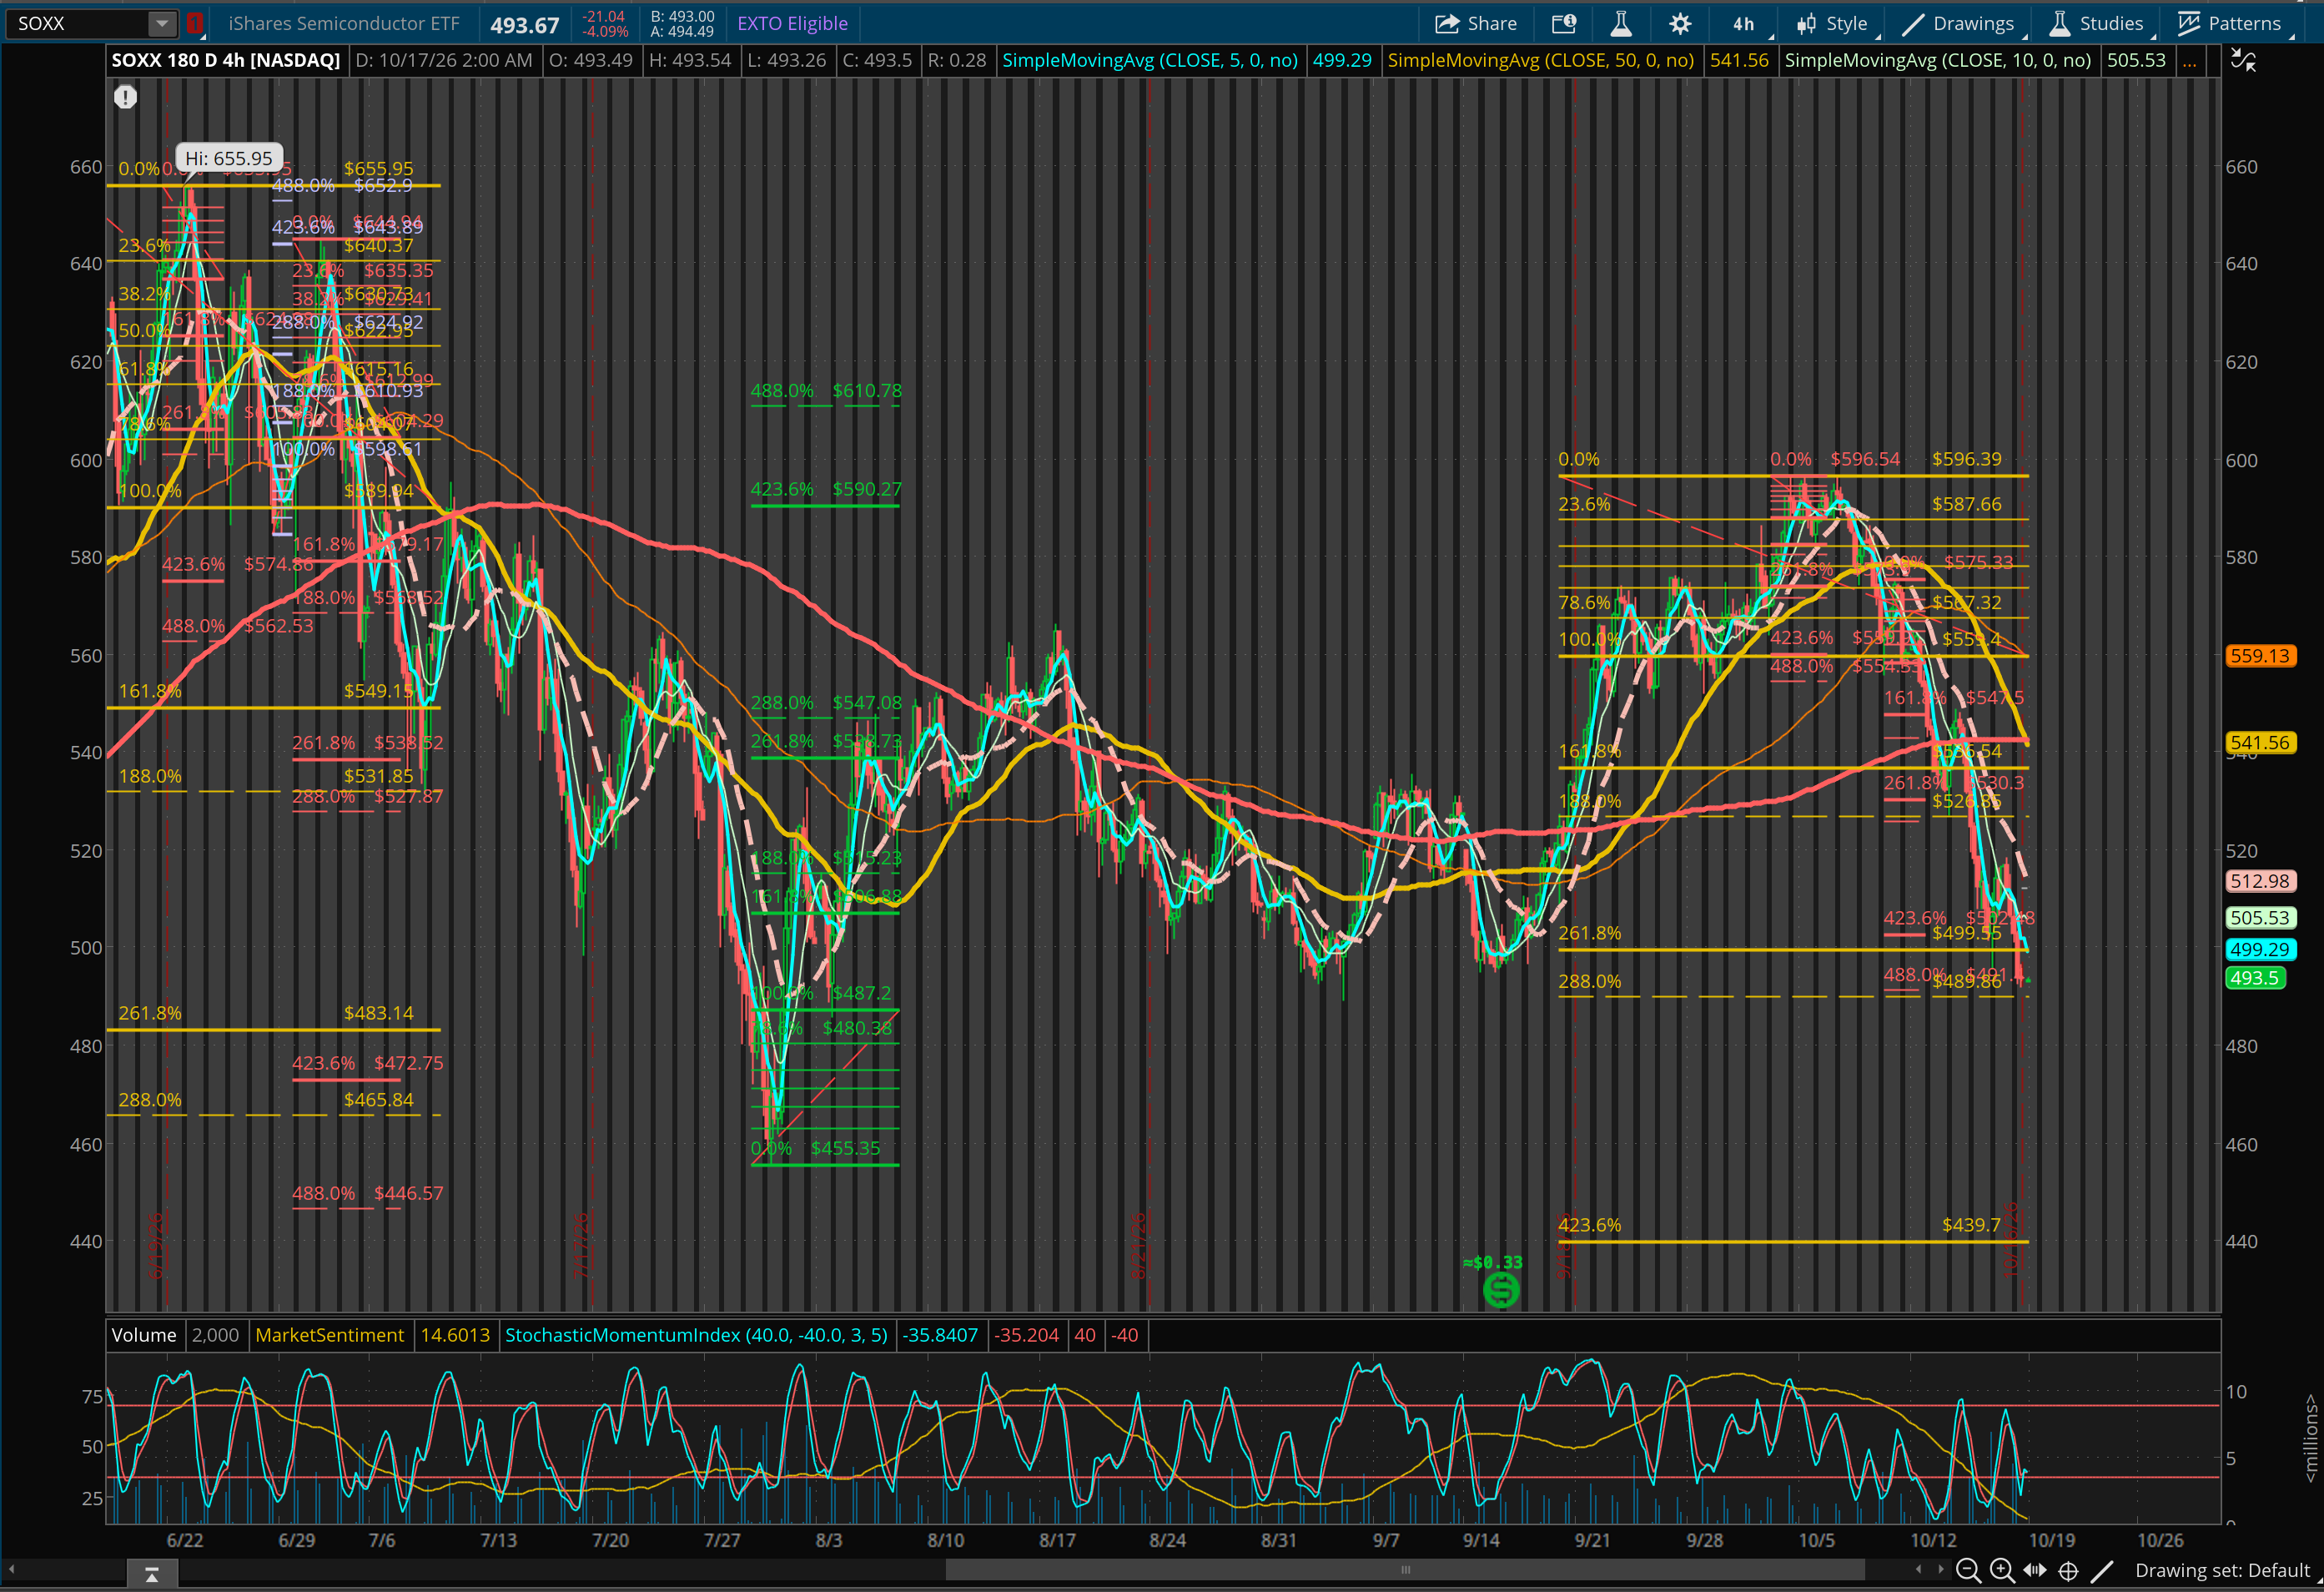 The 4h timeframe shows that SOXX just completed its 4h move down (red signal), hence a small rebound is expected to commence soon.
Indicators
There are several Indicators that caught my attention.
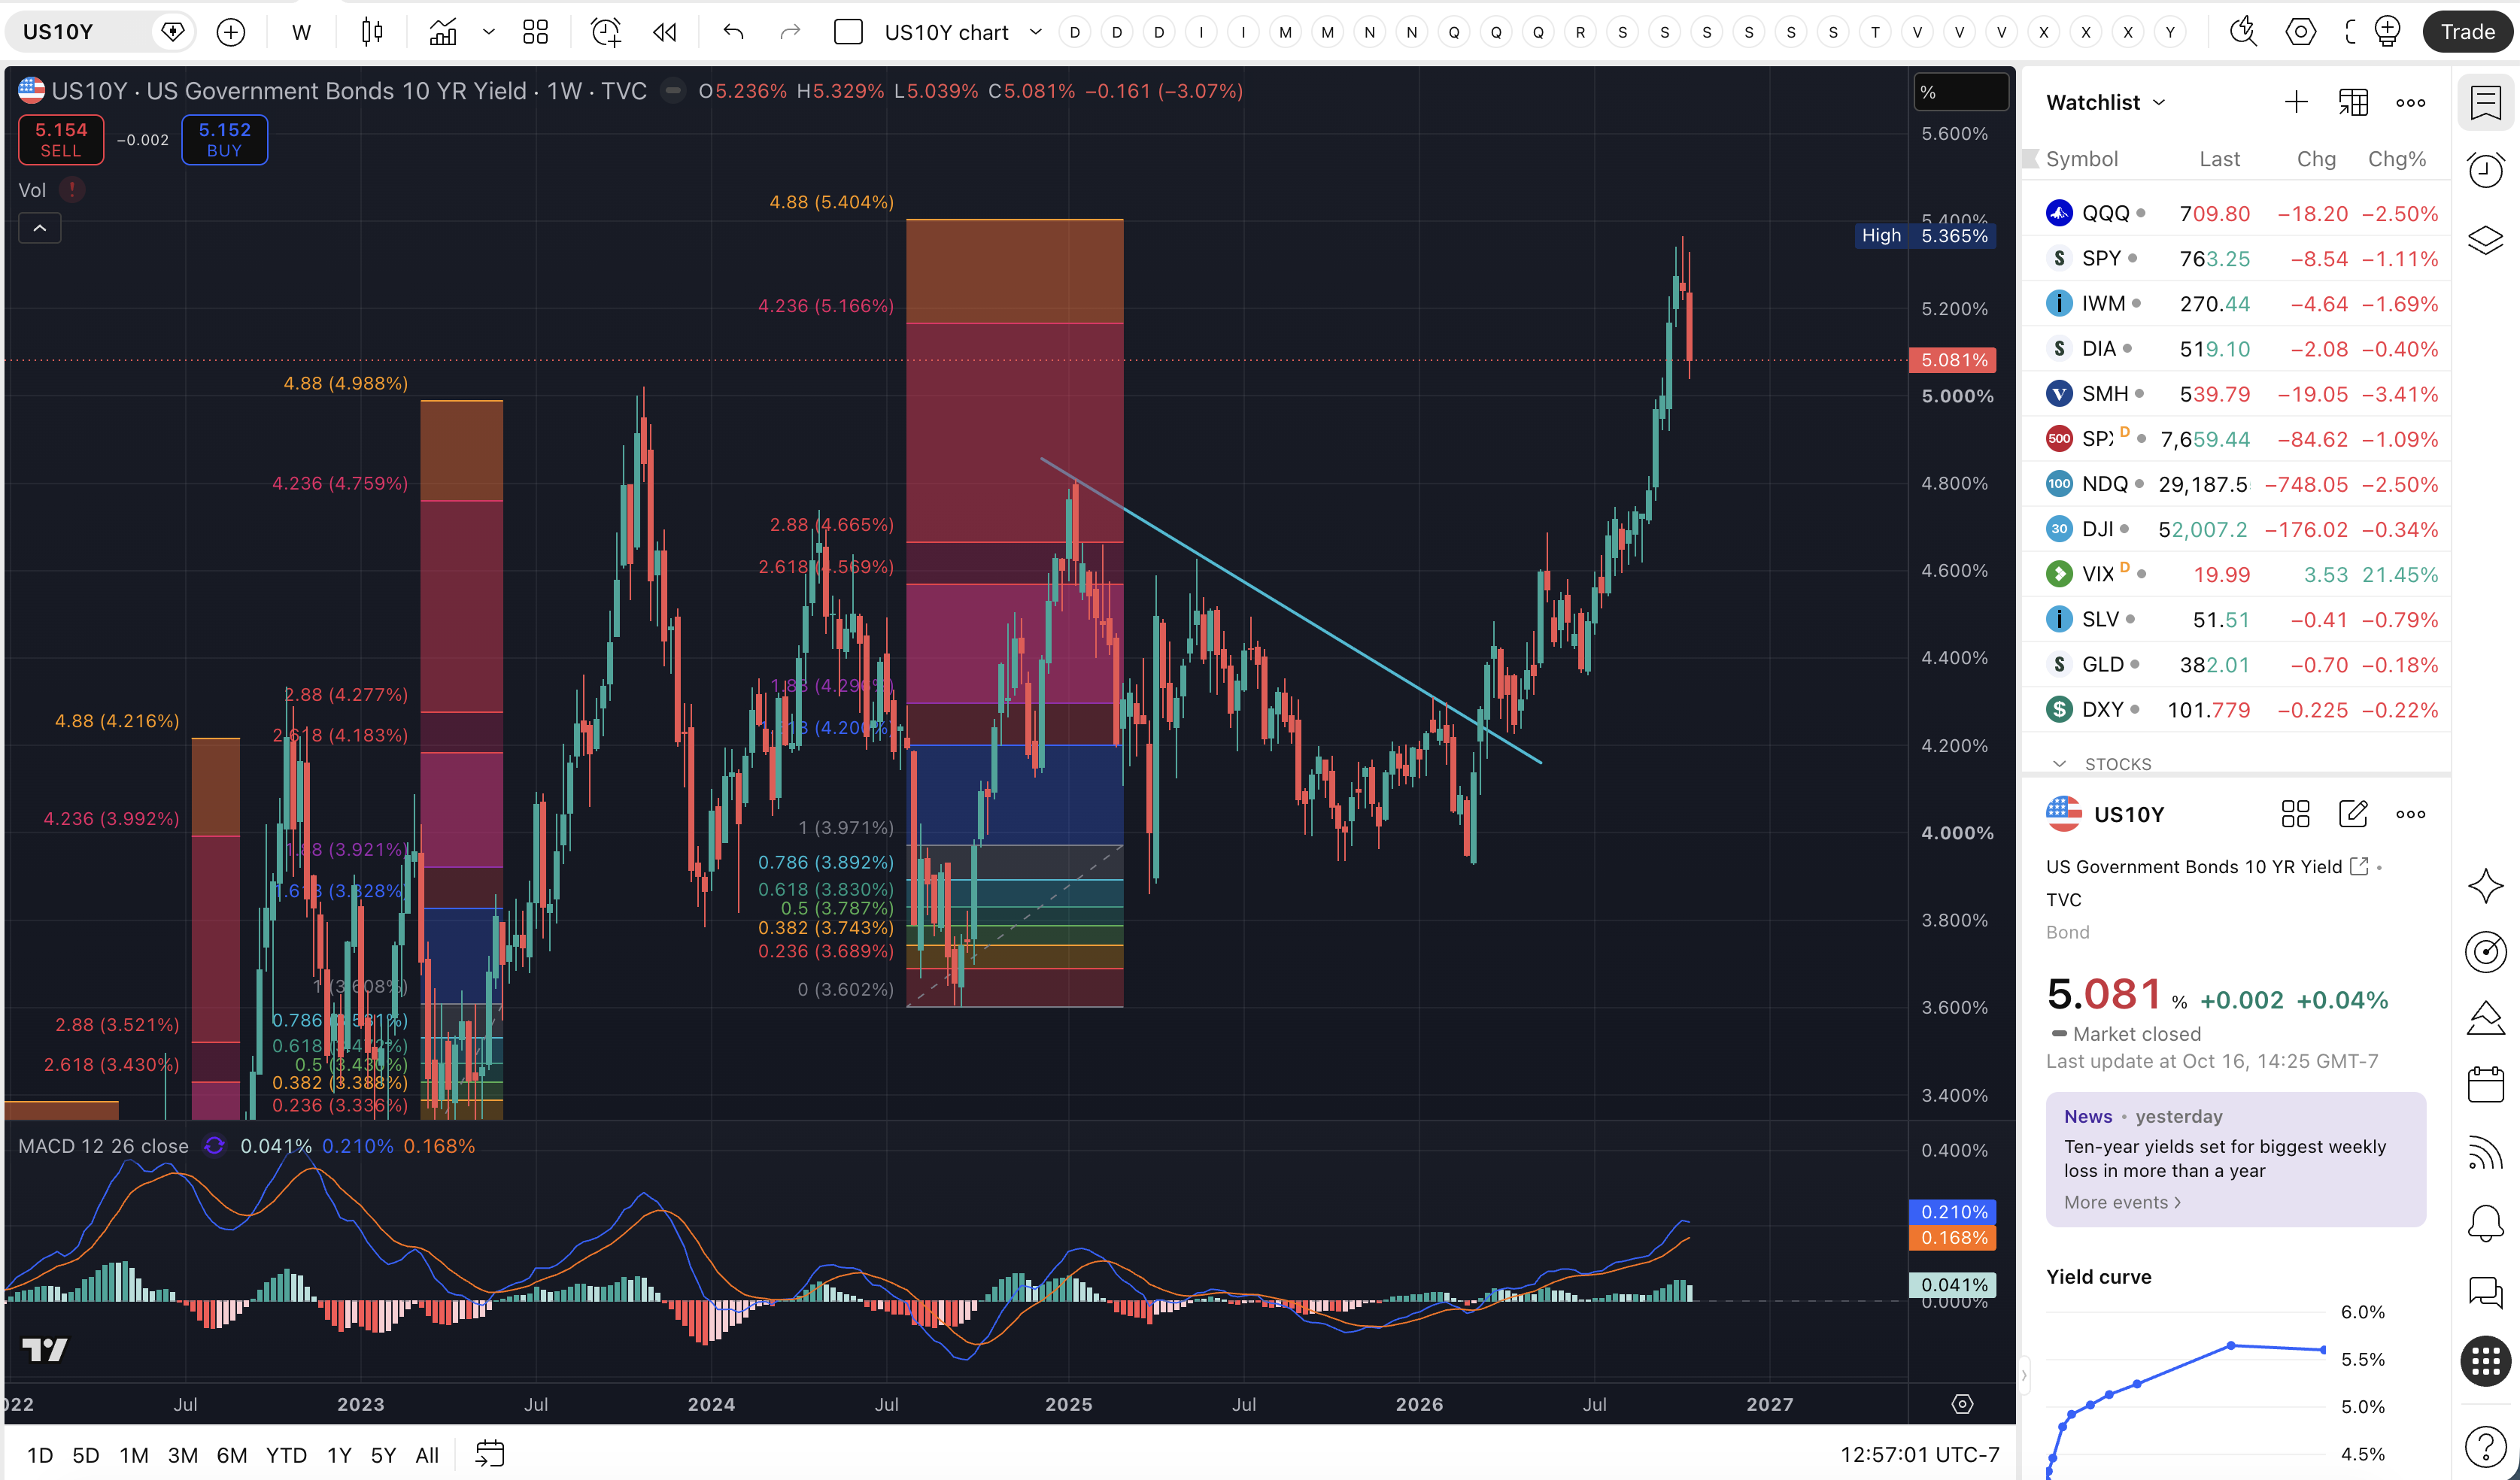 10y yield dropped like a rock in the past week, after we called out both here and in my X account (https://x.com/candlebreaking) that it has reached weekly TP3 area. This generally benefits rate-sensitive sectors like XLP, XLU, etc.
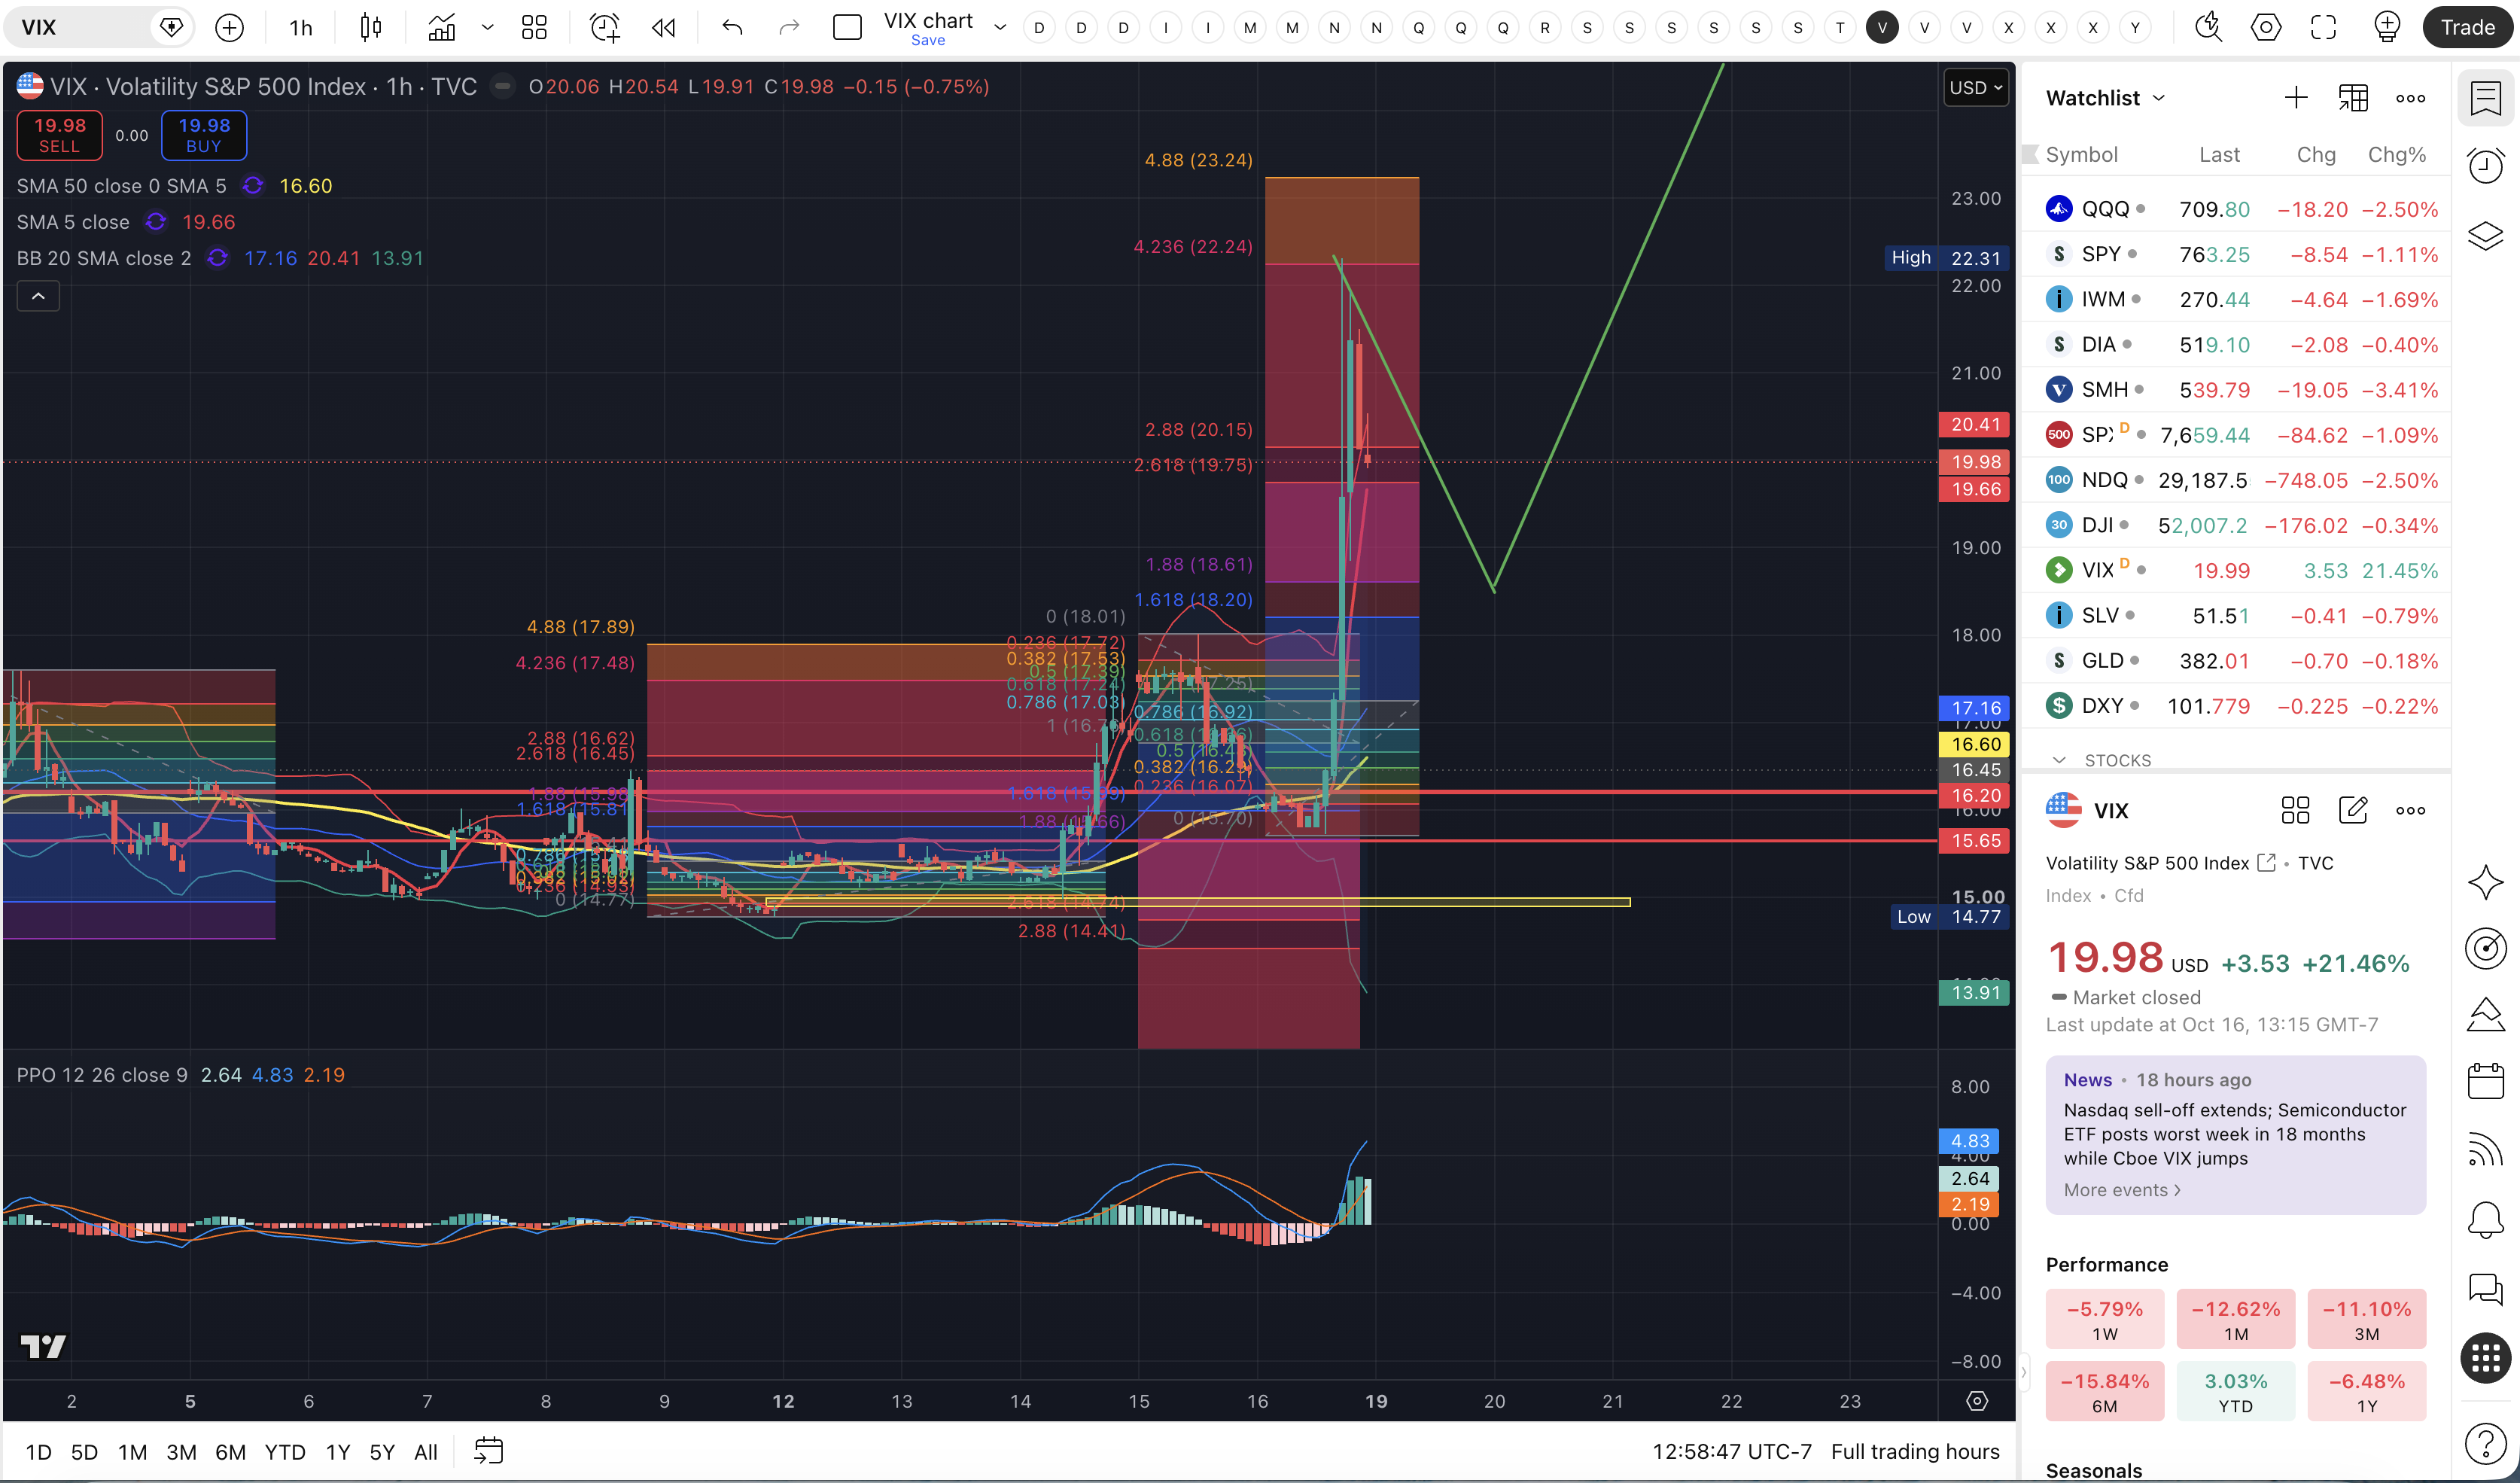 VIX only pulled back to TP1 on Thursday, then broke major resistance area and surge to the new 1h TP3.
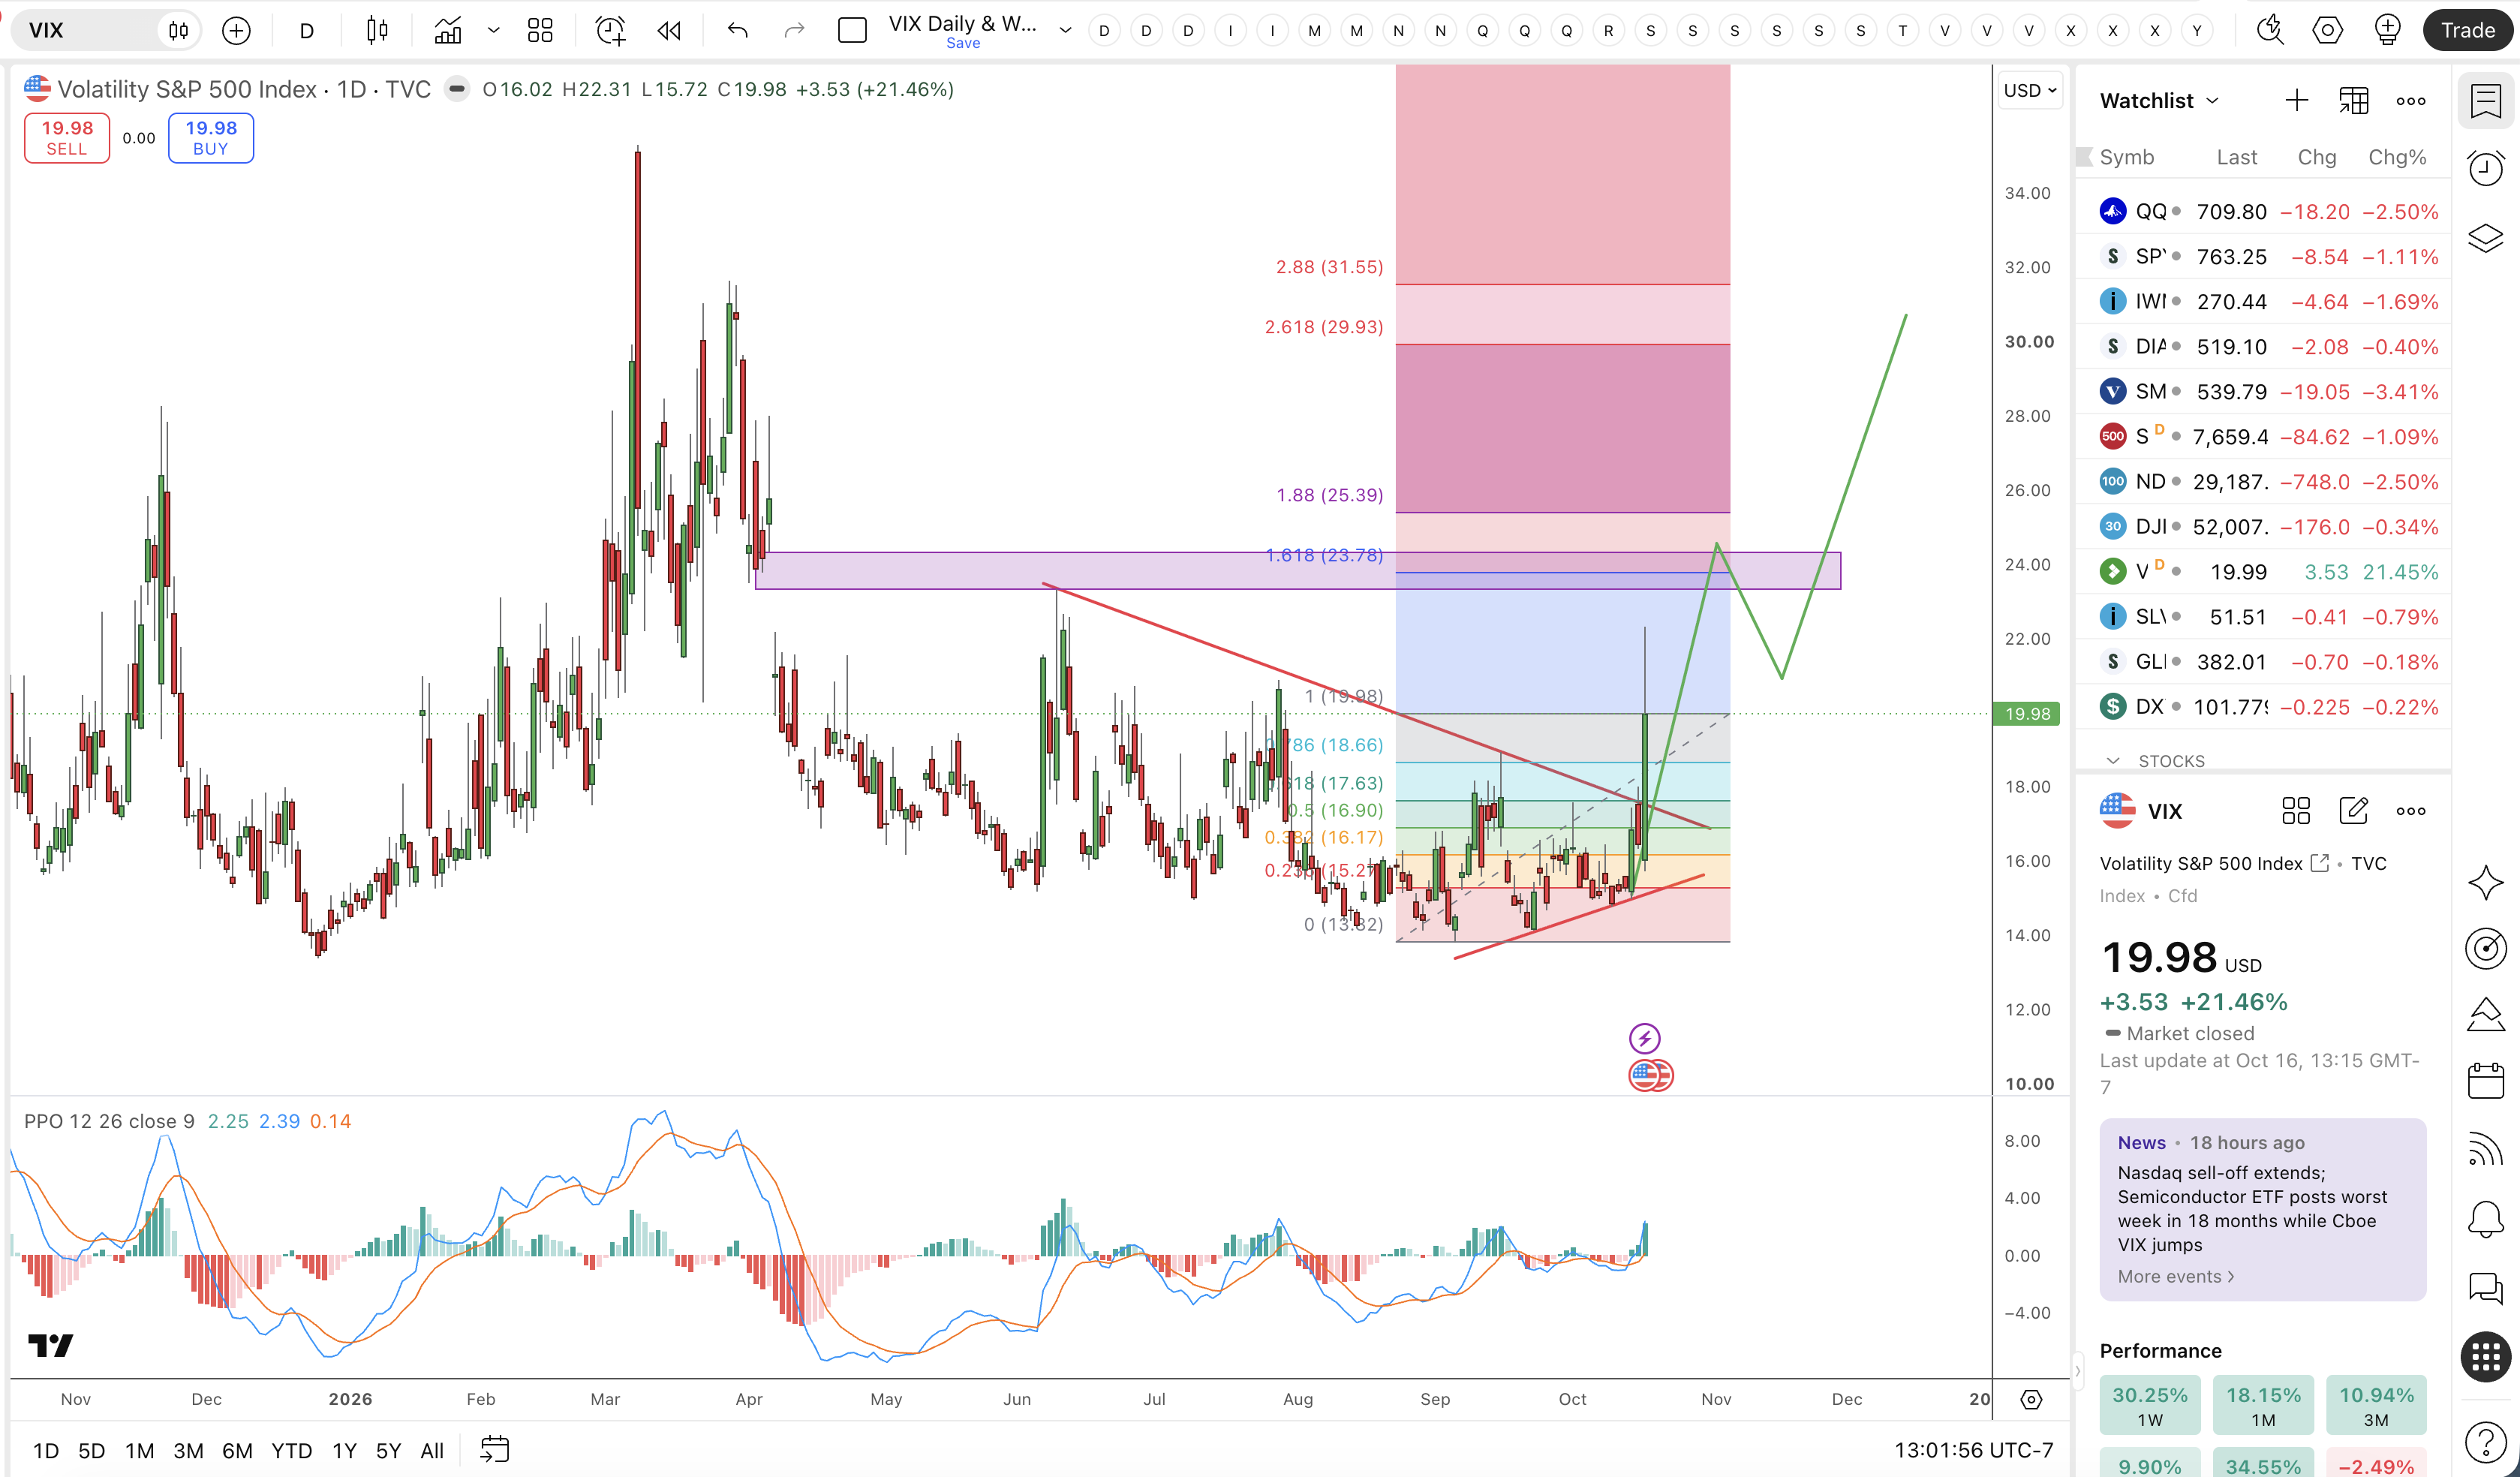 Meanwhile a huge daily bullish signal was formed at Friday close, where TP1 corresponds to a huge daily gap to be filled.
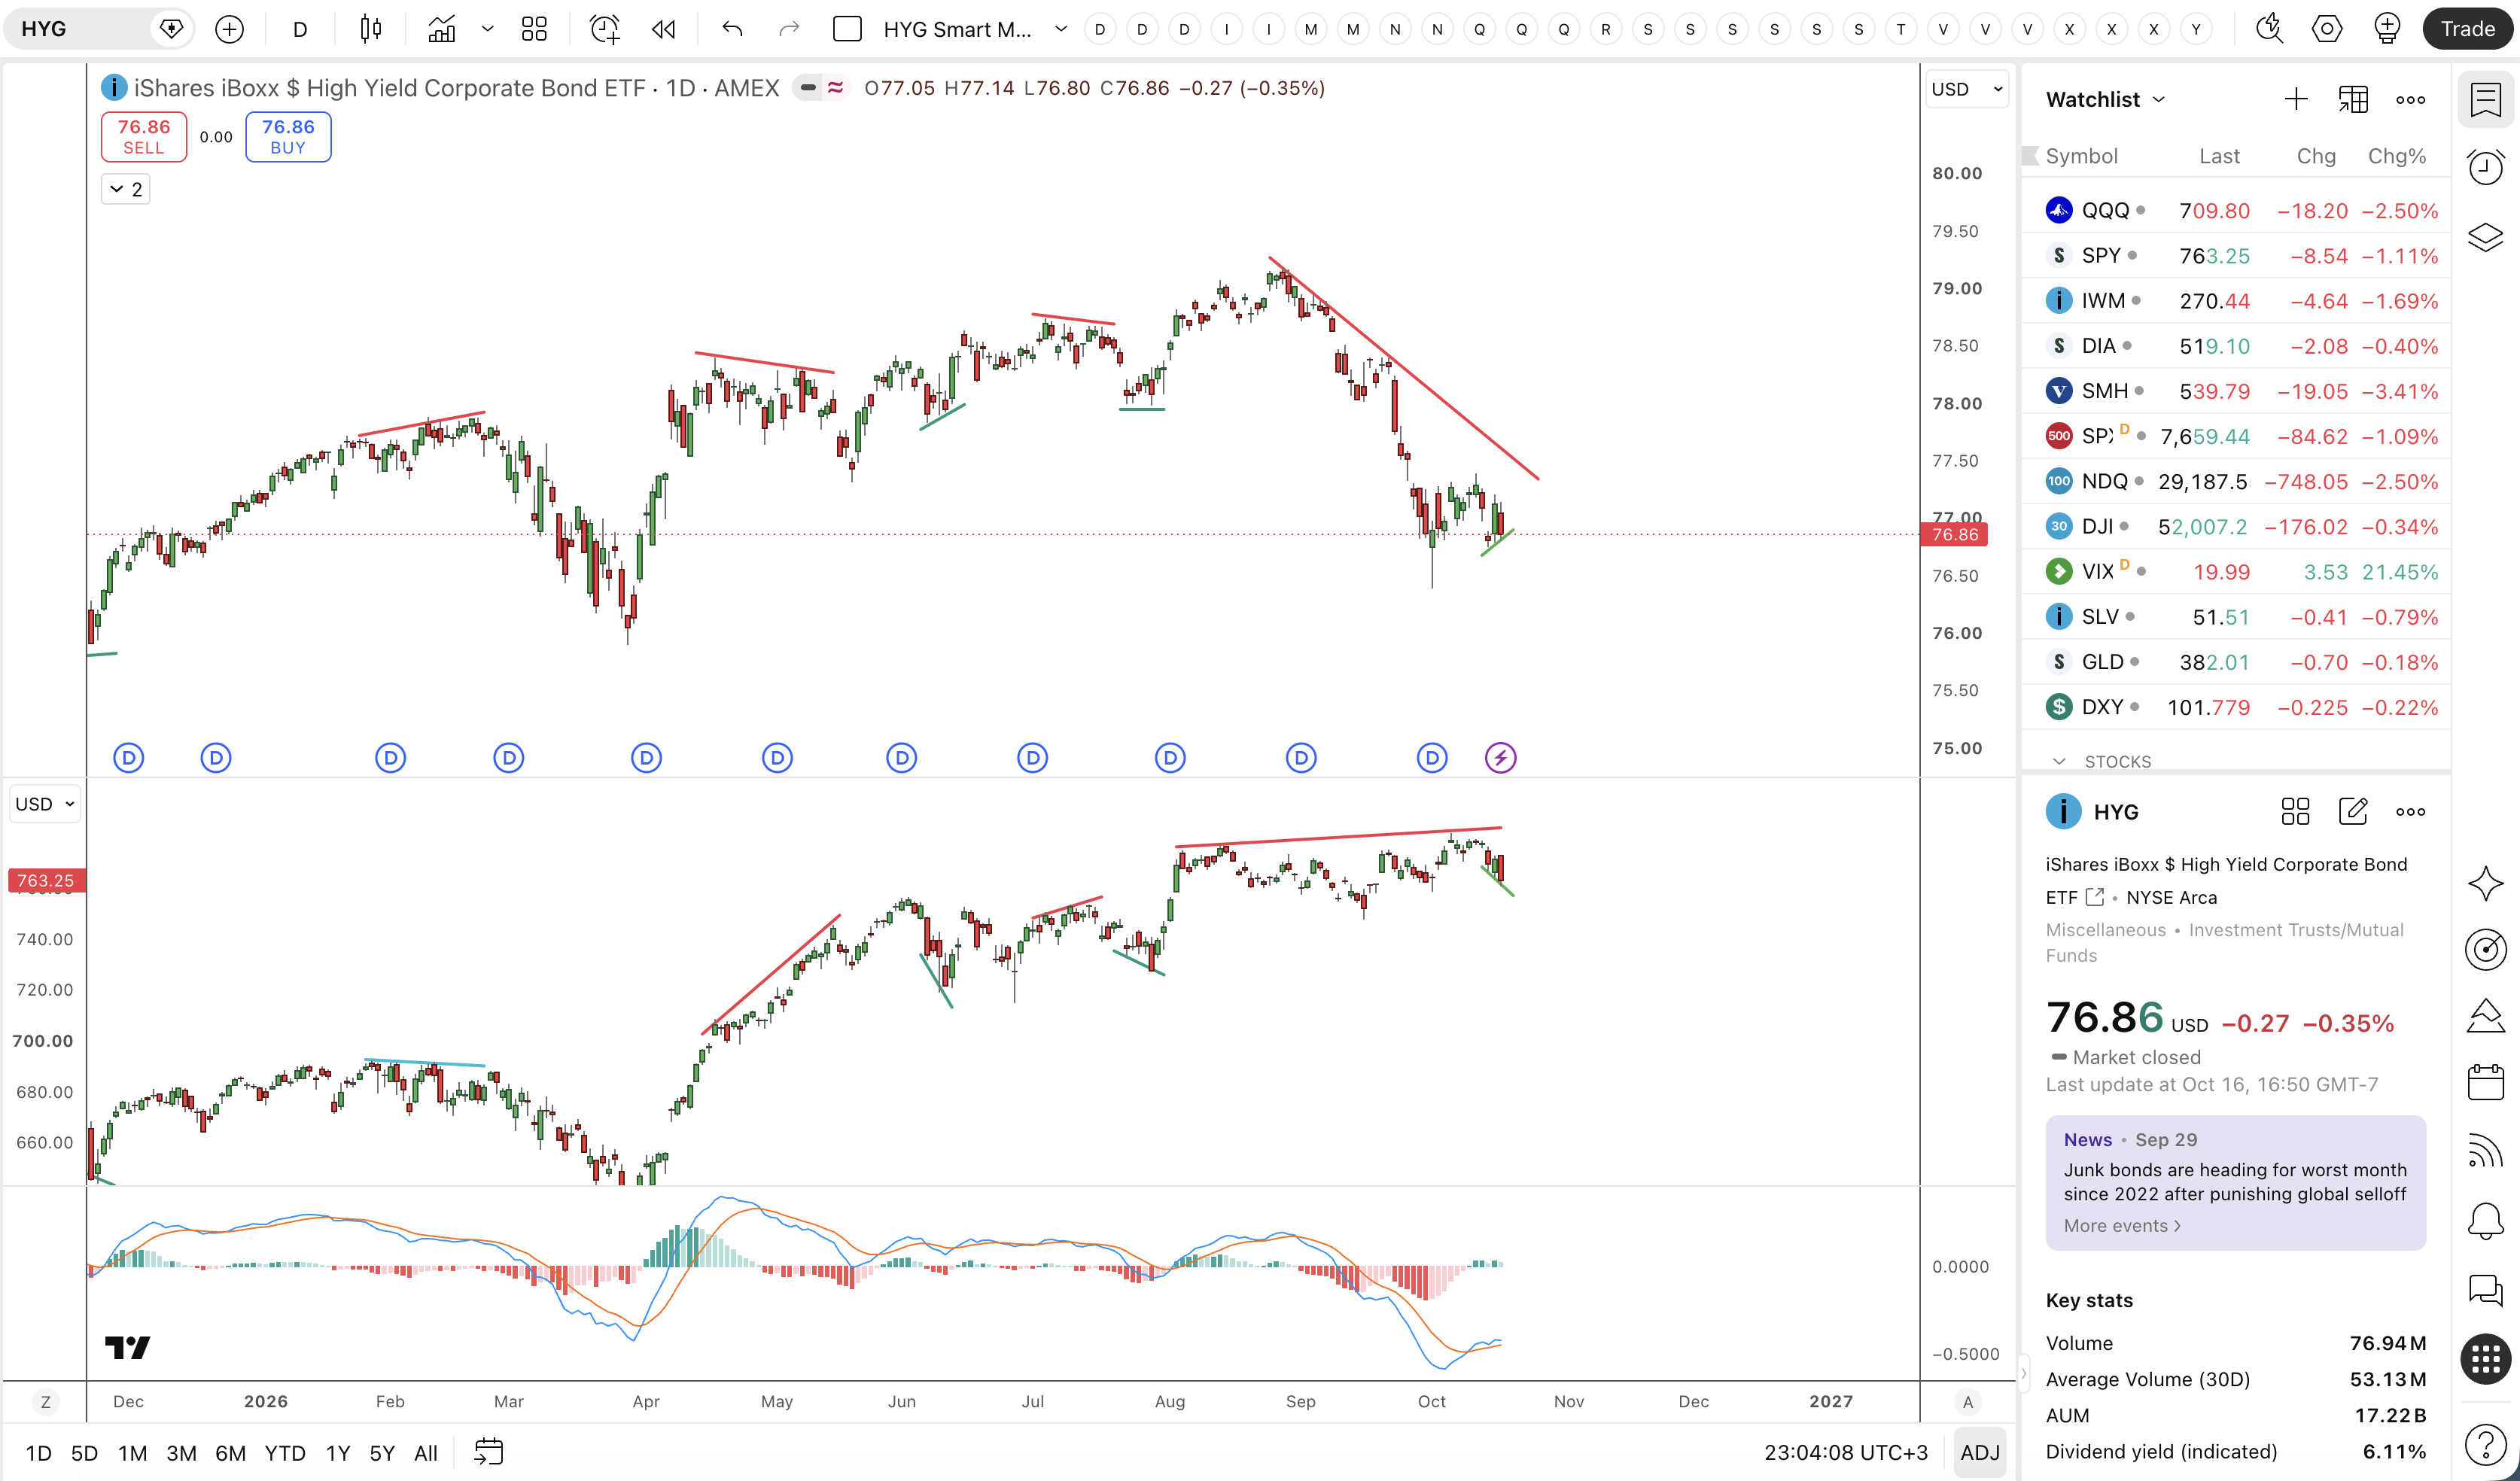 There's a subtle bullish divergence in smart money vs. dumb money chart (SPX made a lower low on Fri while HYG didn't), which is usually followed by a weak bounce. When there's a larger bullish divergence formed, I will make a timely post around that.
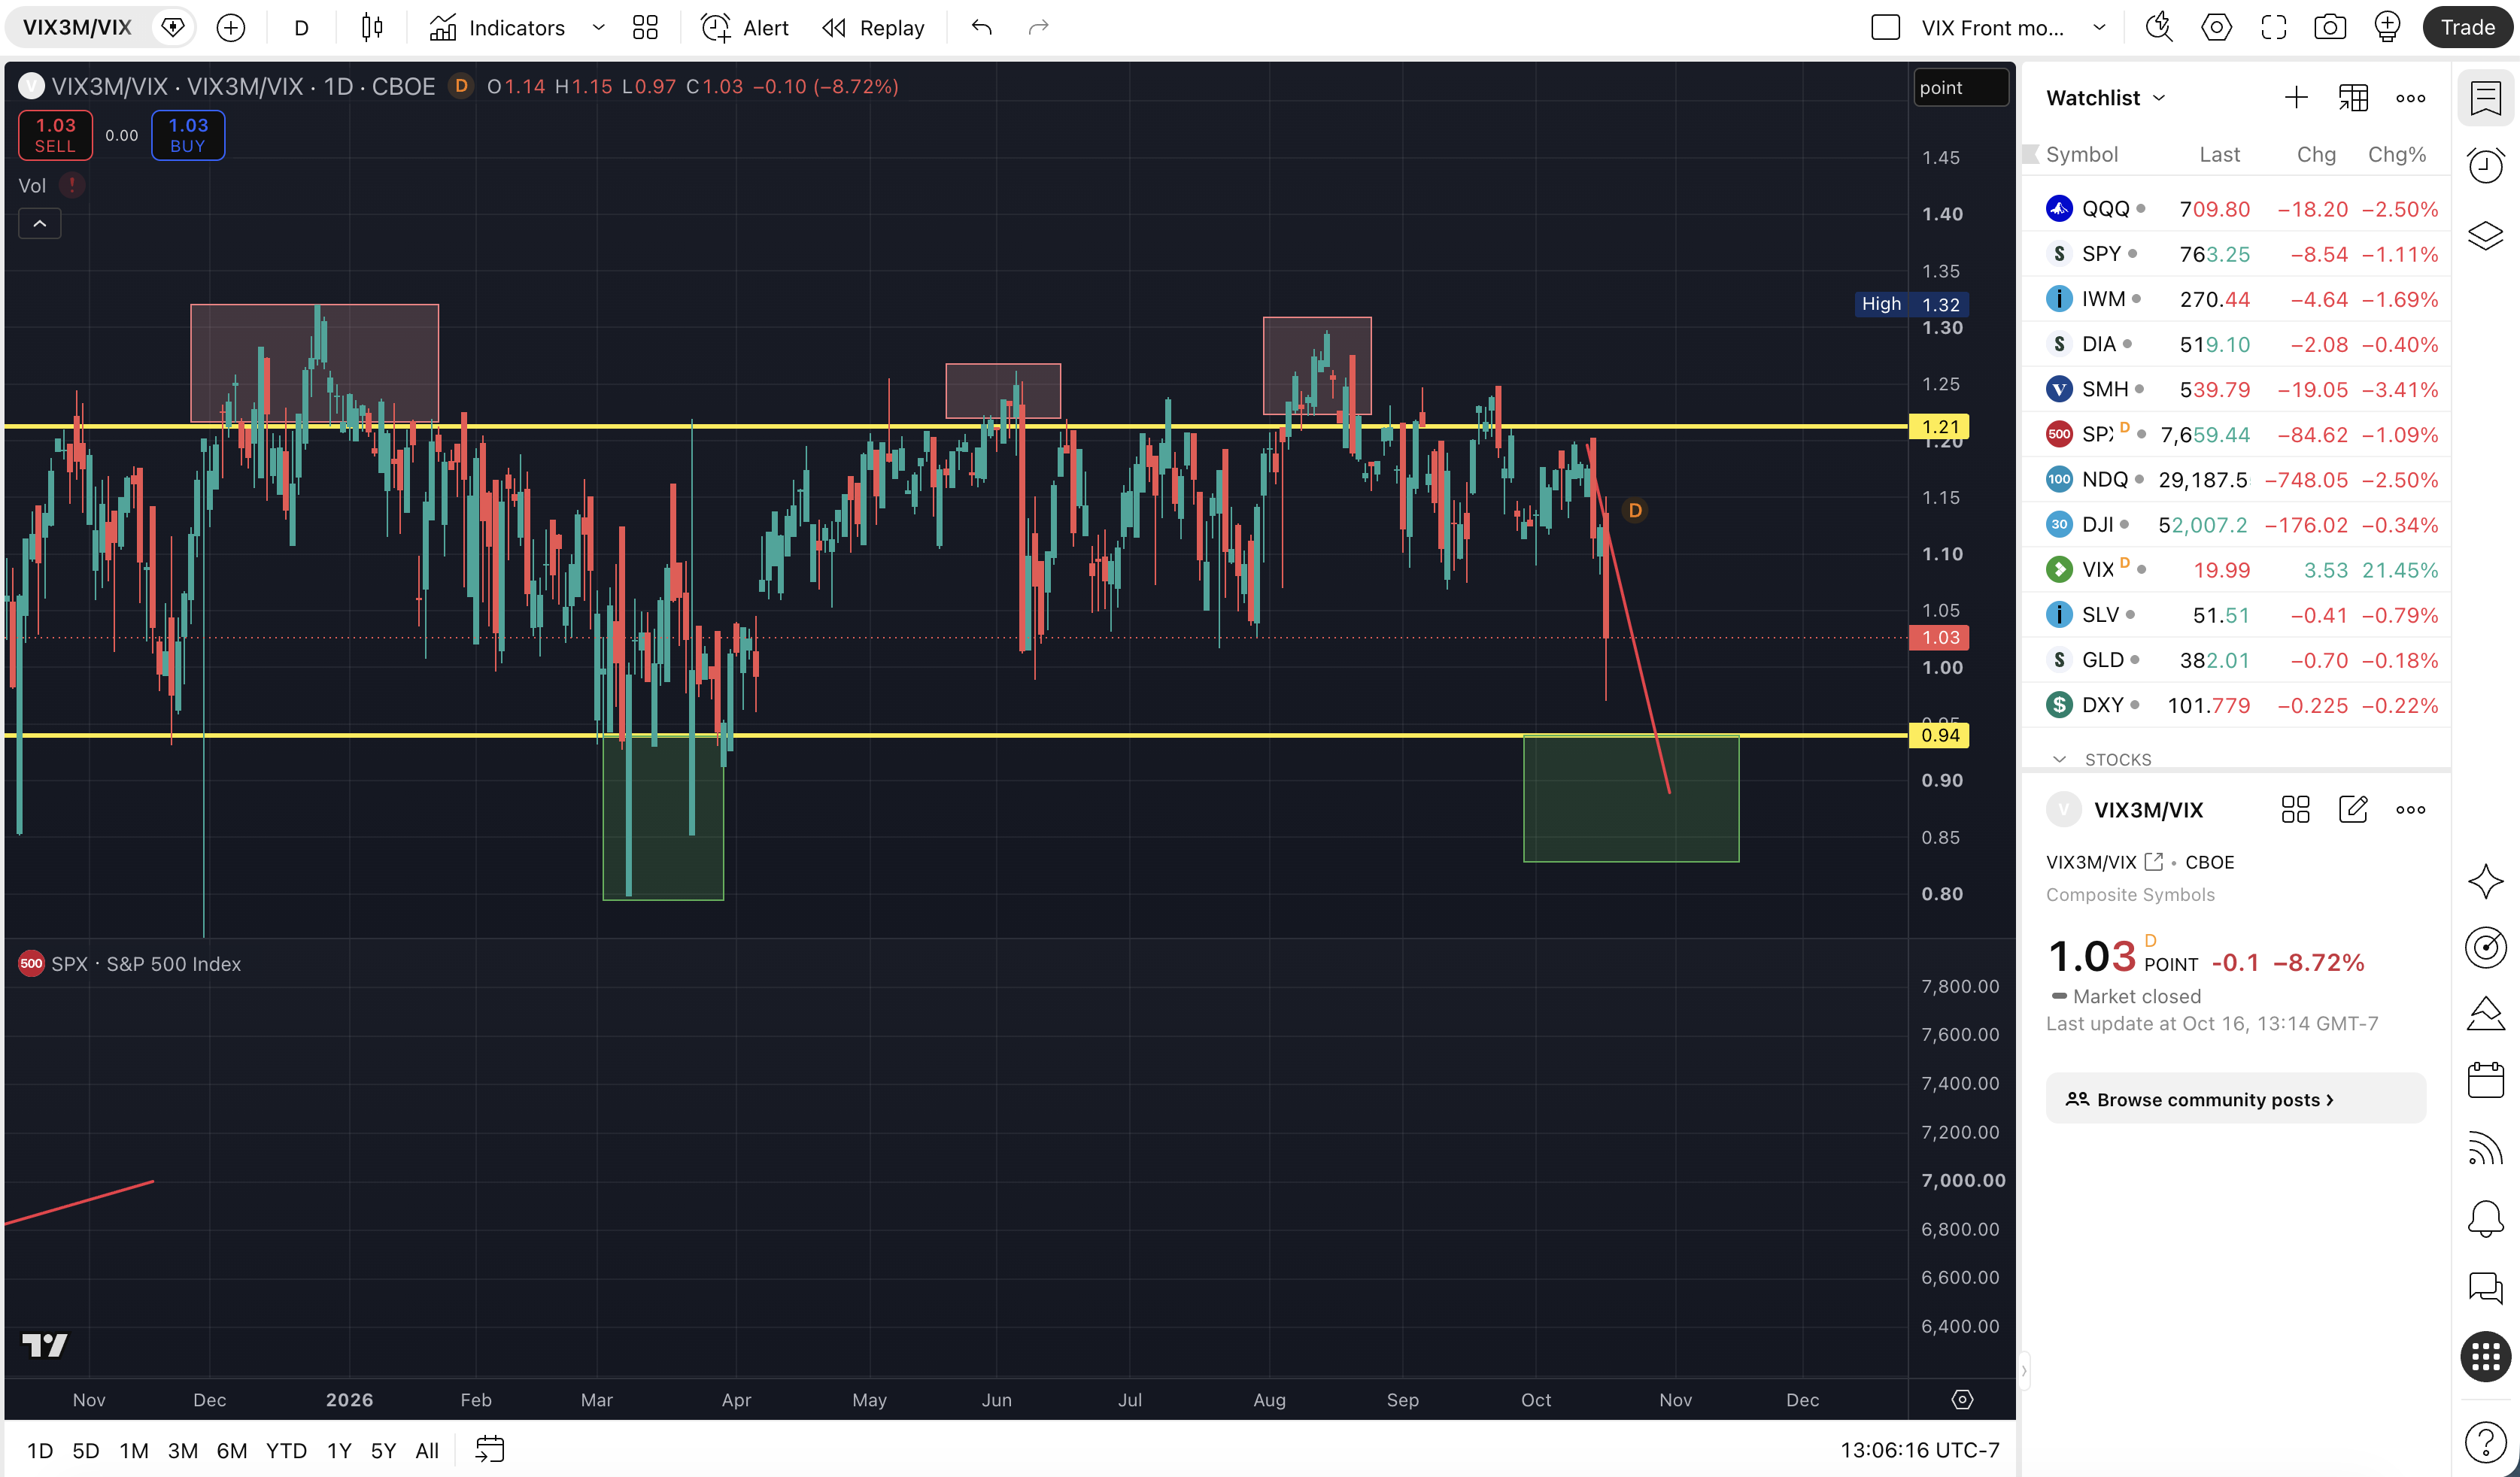 Also if front month vs. back month ratio dropped to the green box region, we will be looking for a large bounce too.
Conclusion
We may see an even lower low next week to form a positive divergence on 4h timeframe, which should create the opportunity for a prolonged, multi-day bounce. But in Nov, there's a high probability that we will see another leg down for SPY, QQQ & SMH to revisit 7/29 low. Dow Jones and Russell 2000 will follow that move synchronously, unlike the dispersion in behavior we are seeing right now. Hence, if you don't know how to short or don't like shorting at all (which I fully recommend here), please wait and come back in November when my targets are achieved. Otherwise, I will post live updates on X and here, especially for subscribers to catch good trading opportunities.