SMH/SOXX Analysis
Weekly / Monthly Timeframe
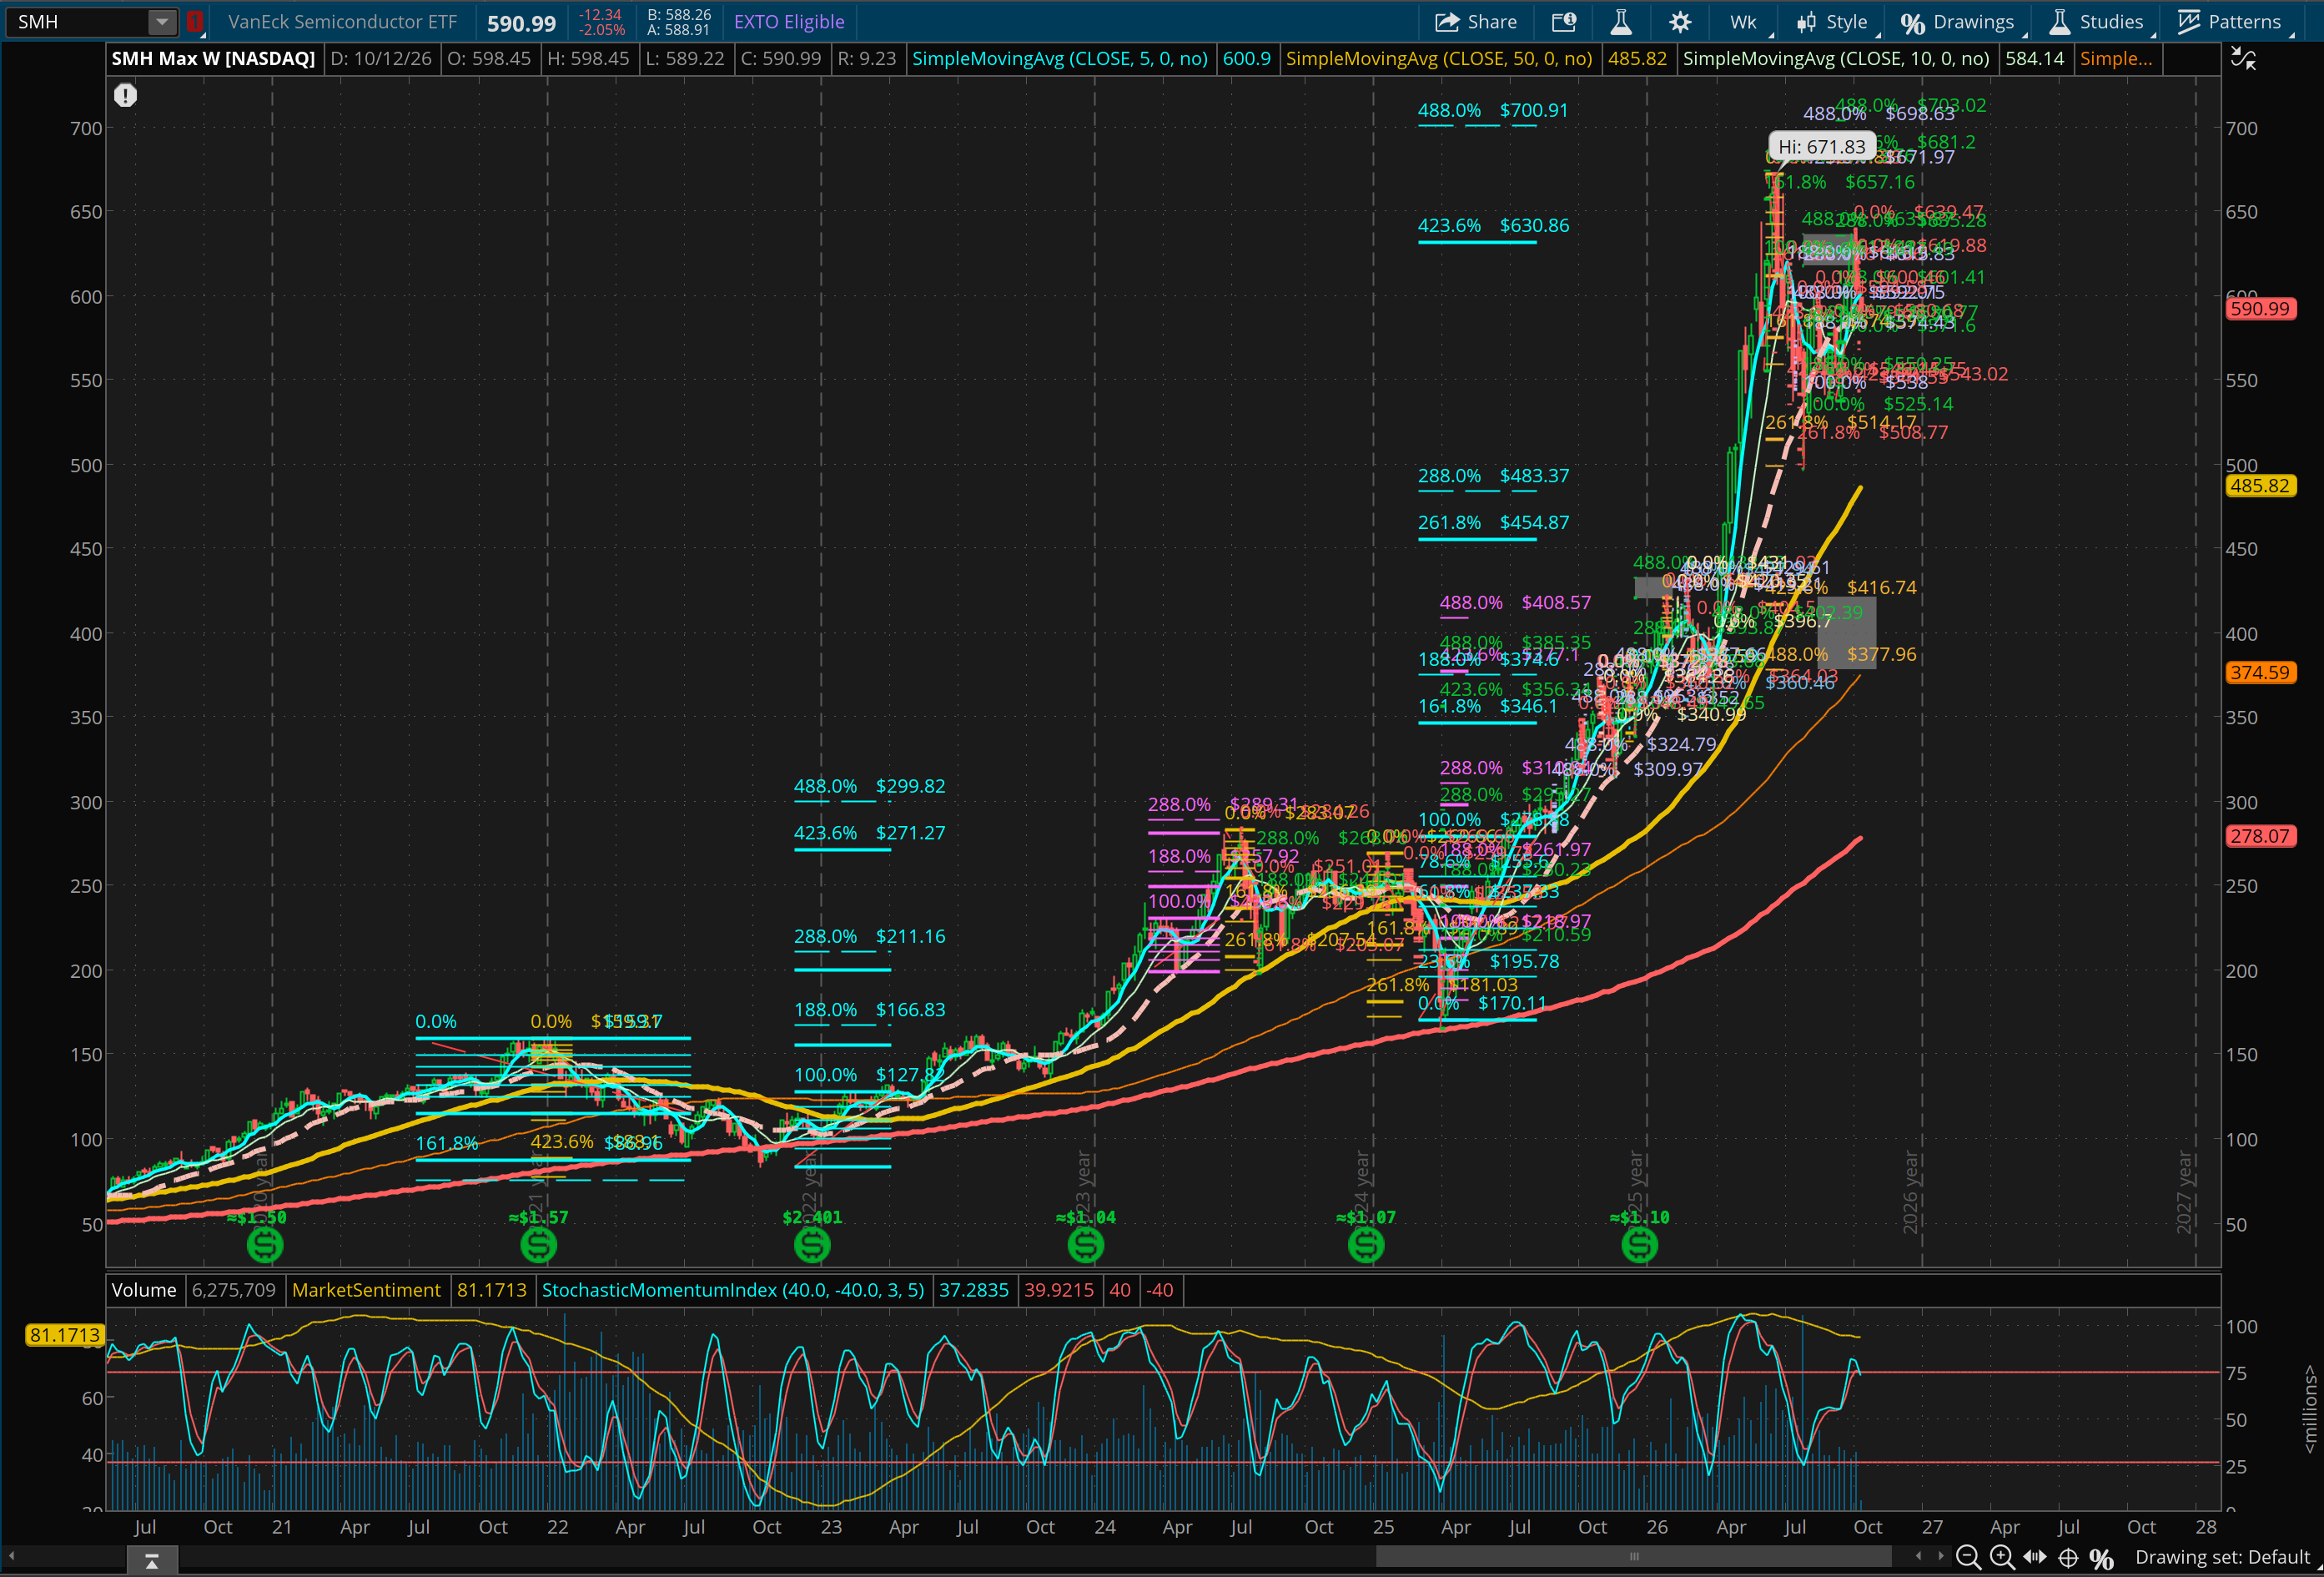
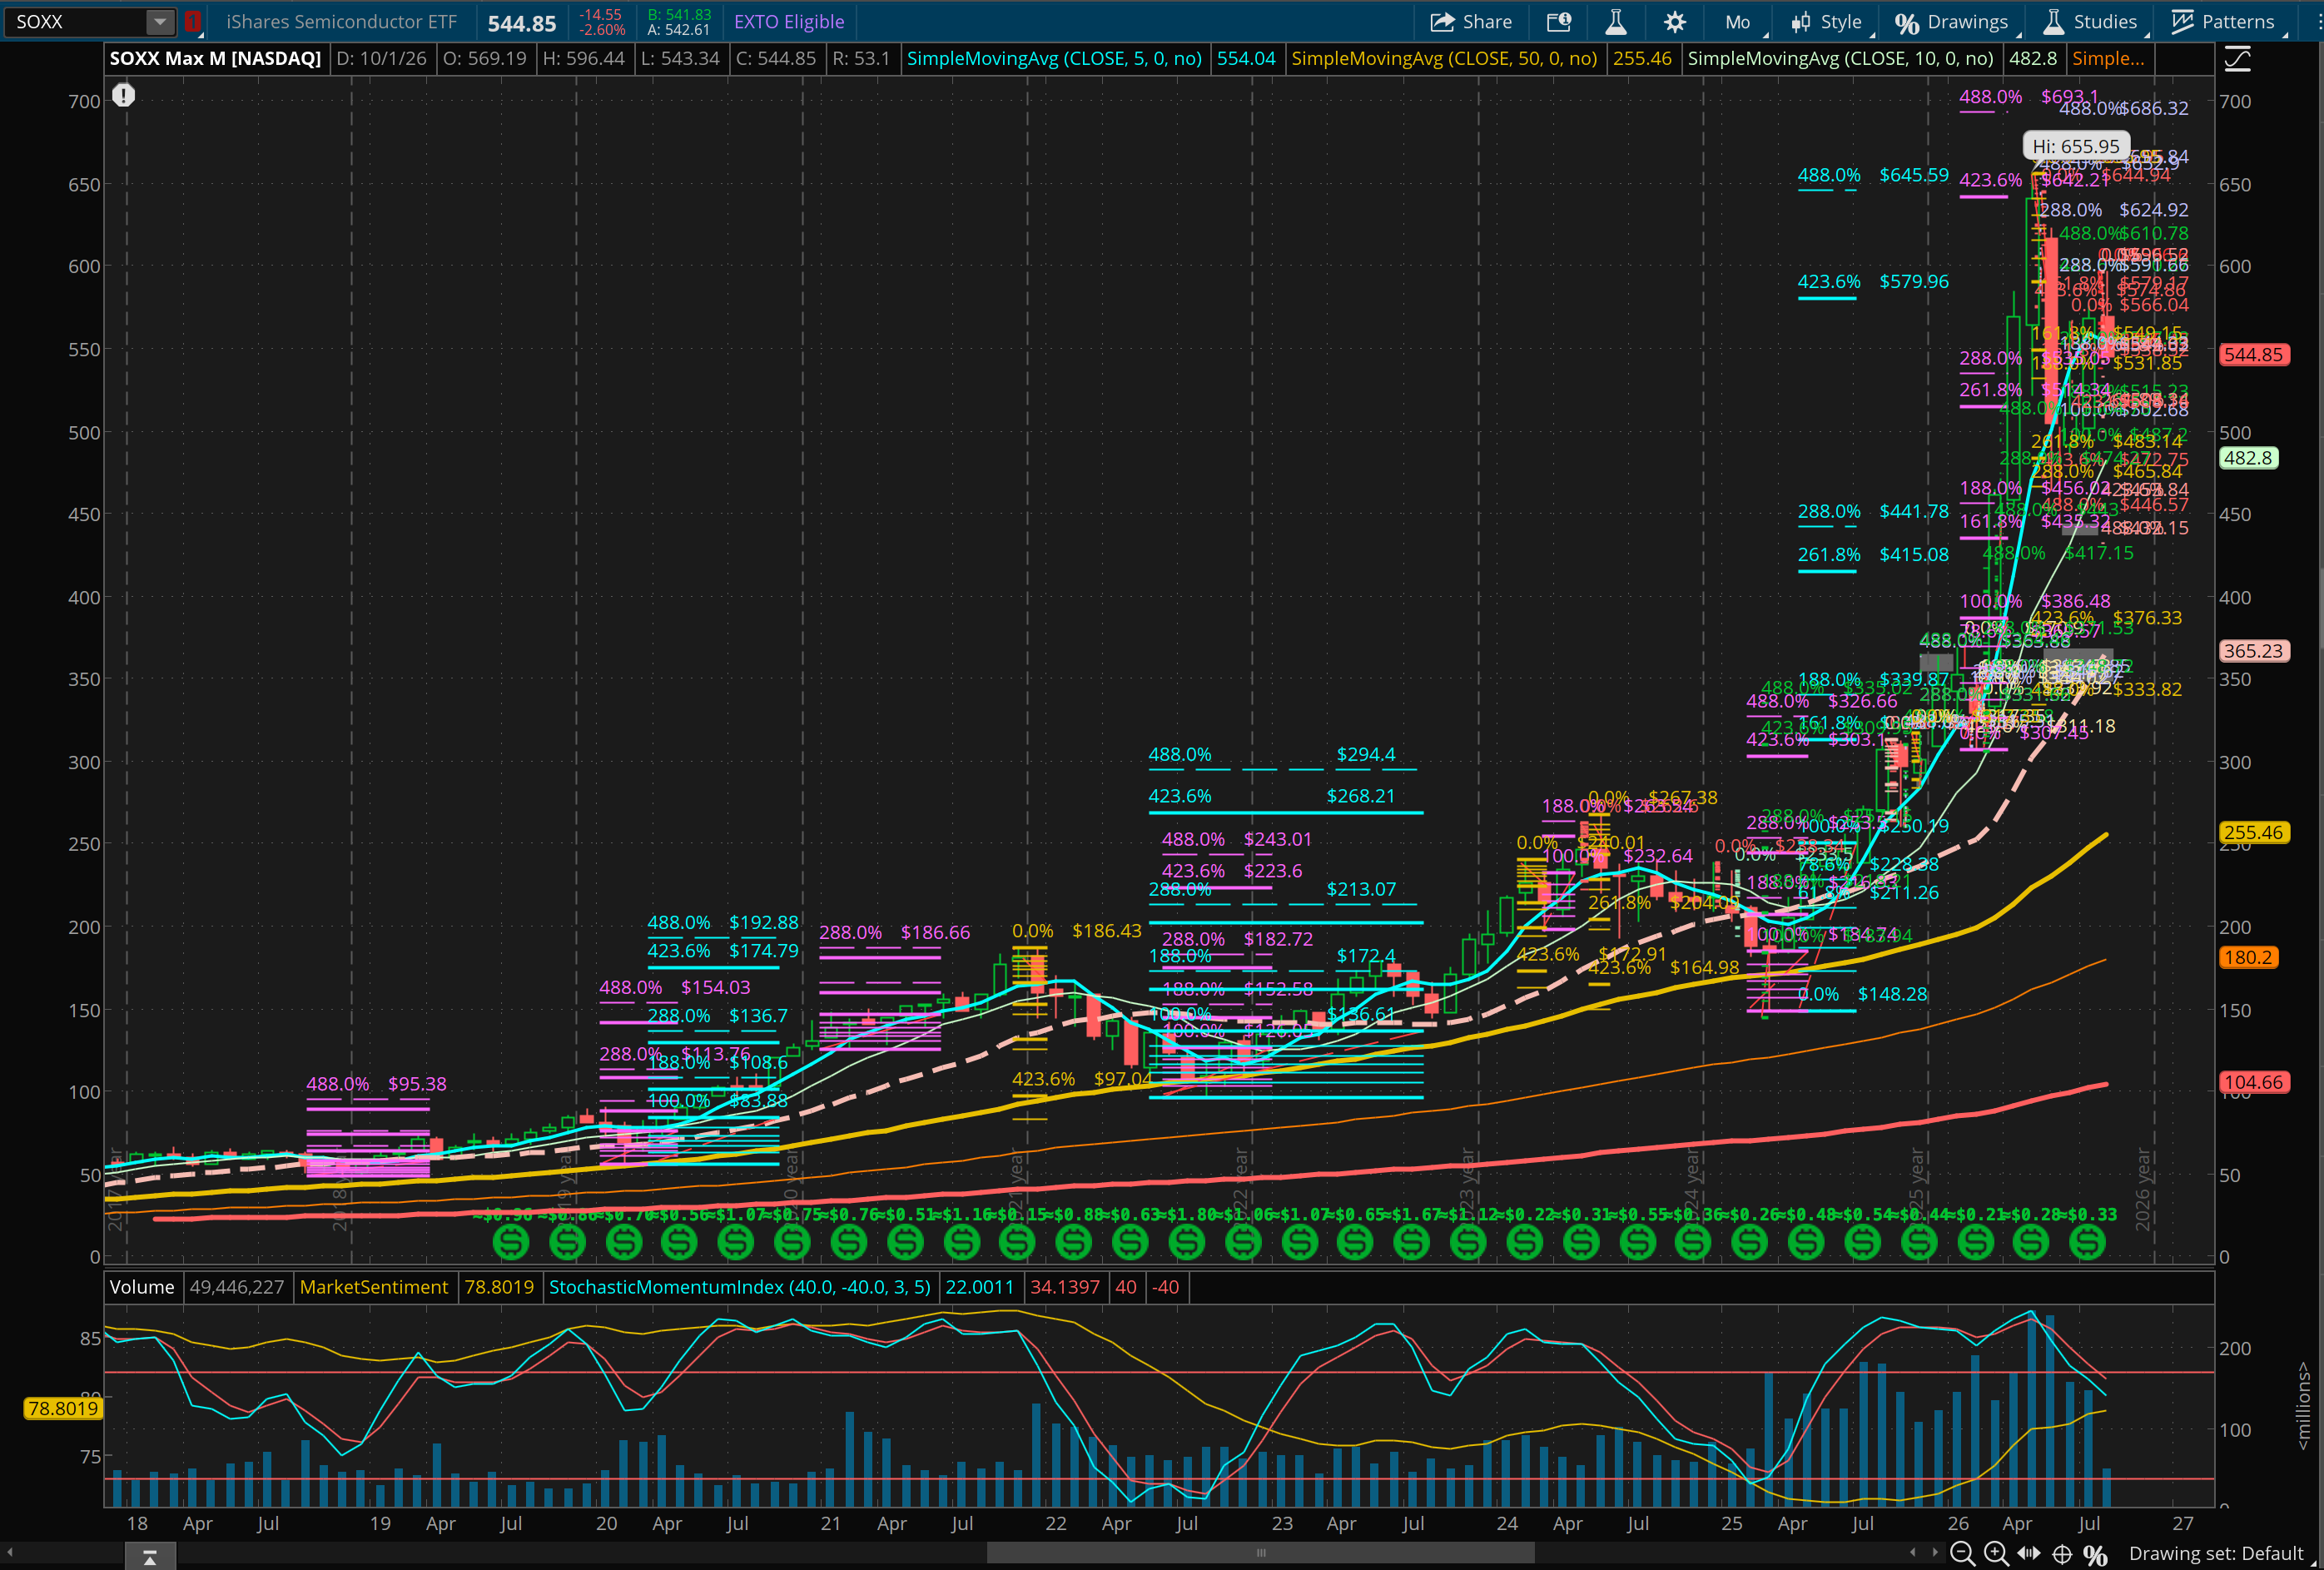 Semiconductor ETFs are known for their large volatilities (high-beta), hence they have been relying on monthly bullish signals (blue ones) to move up. Note that in the history, every time it touches TP3 of monthly signal, they will have to spend multiple months to pull back, consolidate and accumulate energy to start over. Right now I don't think it has finished that process yet, and it's very likely that we could see another violent drop pretty soon.
4h Timeframe
SOXX
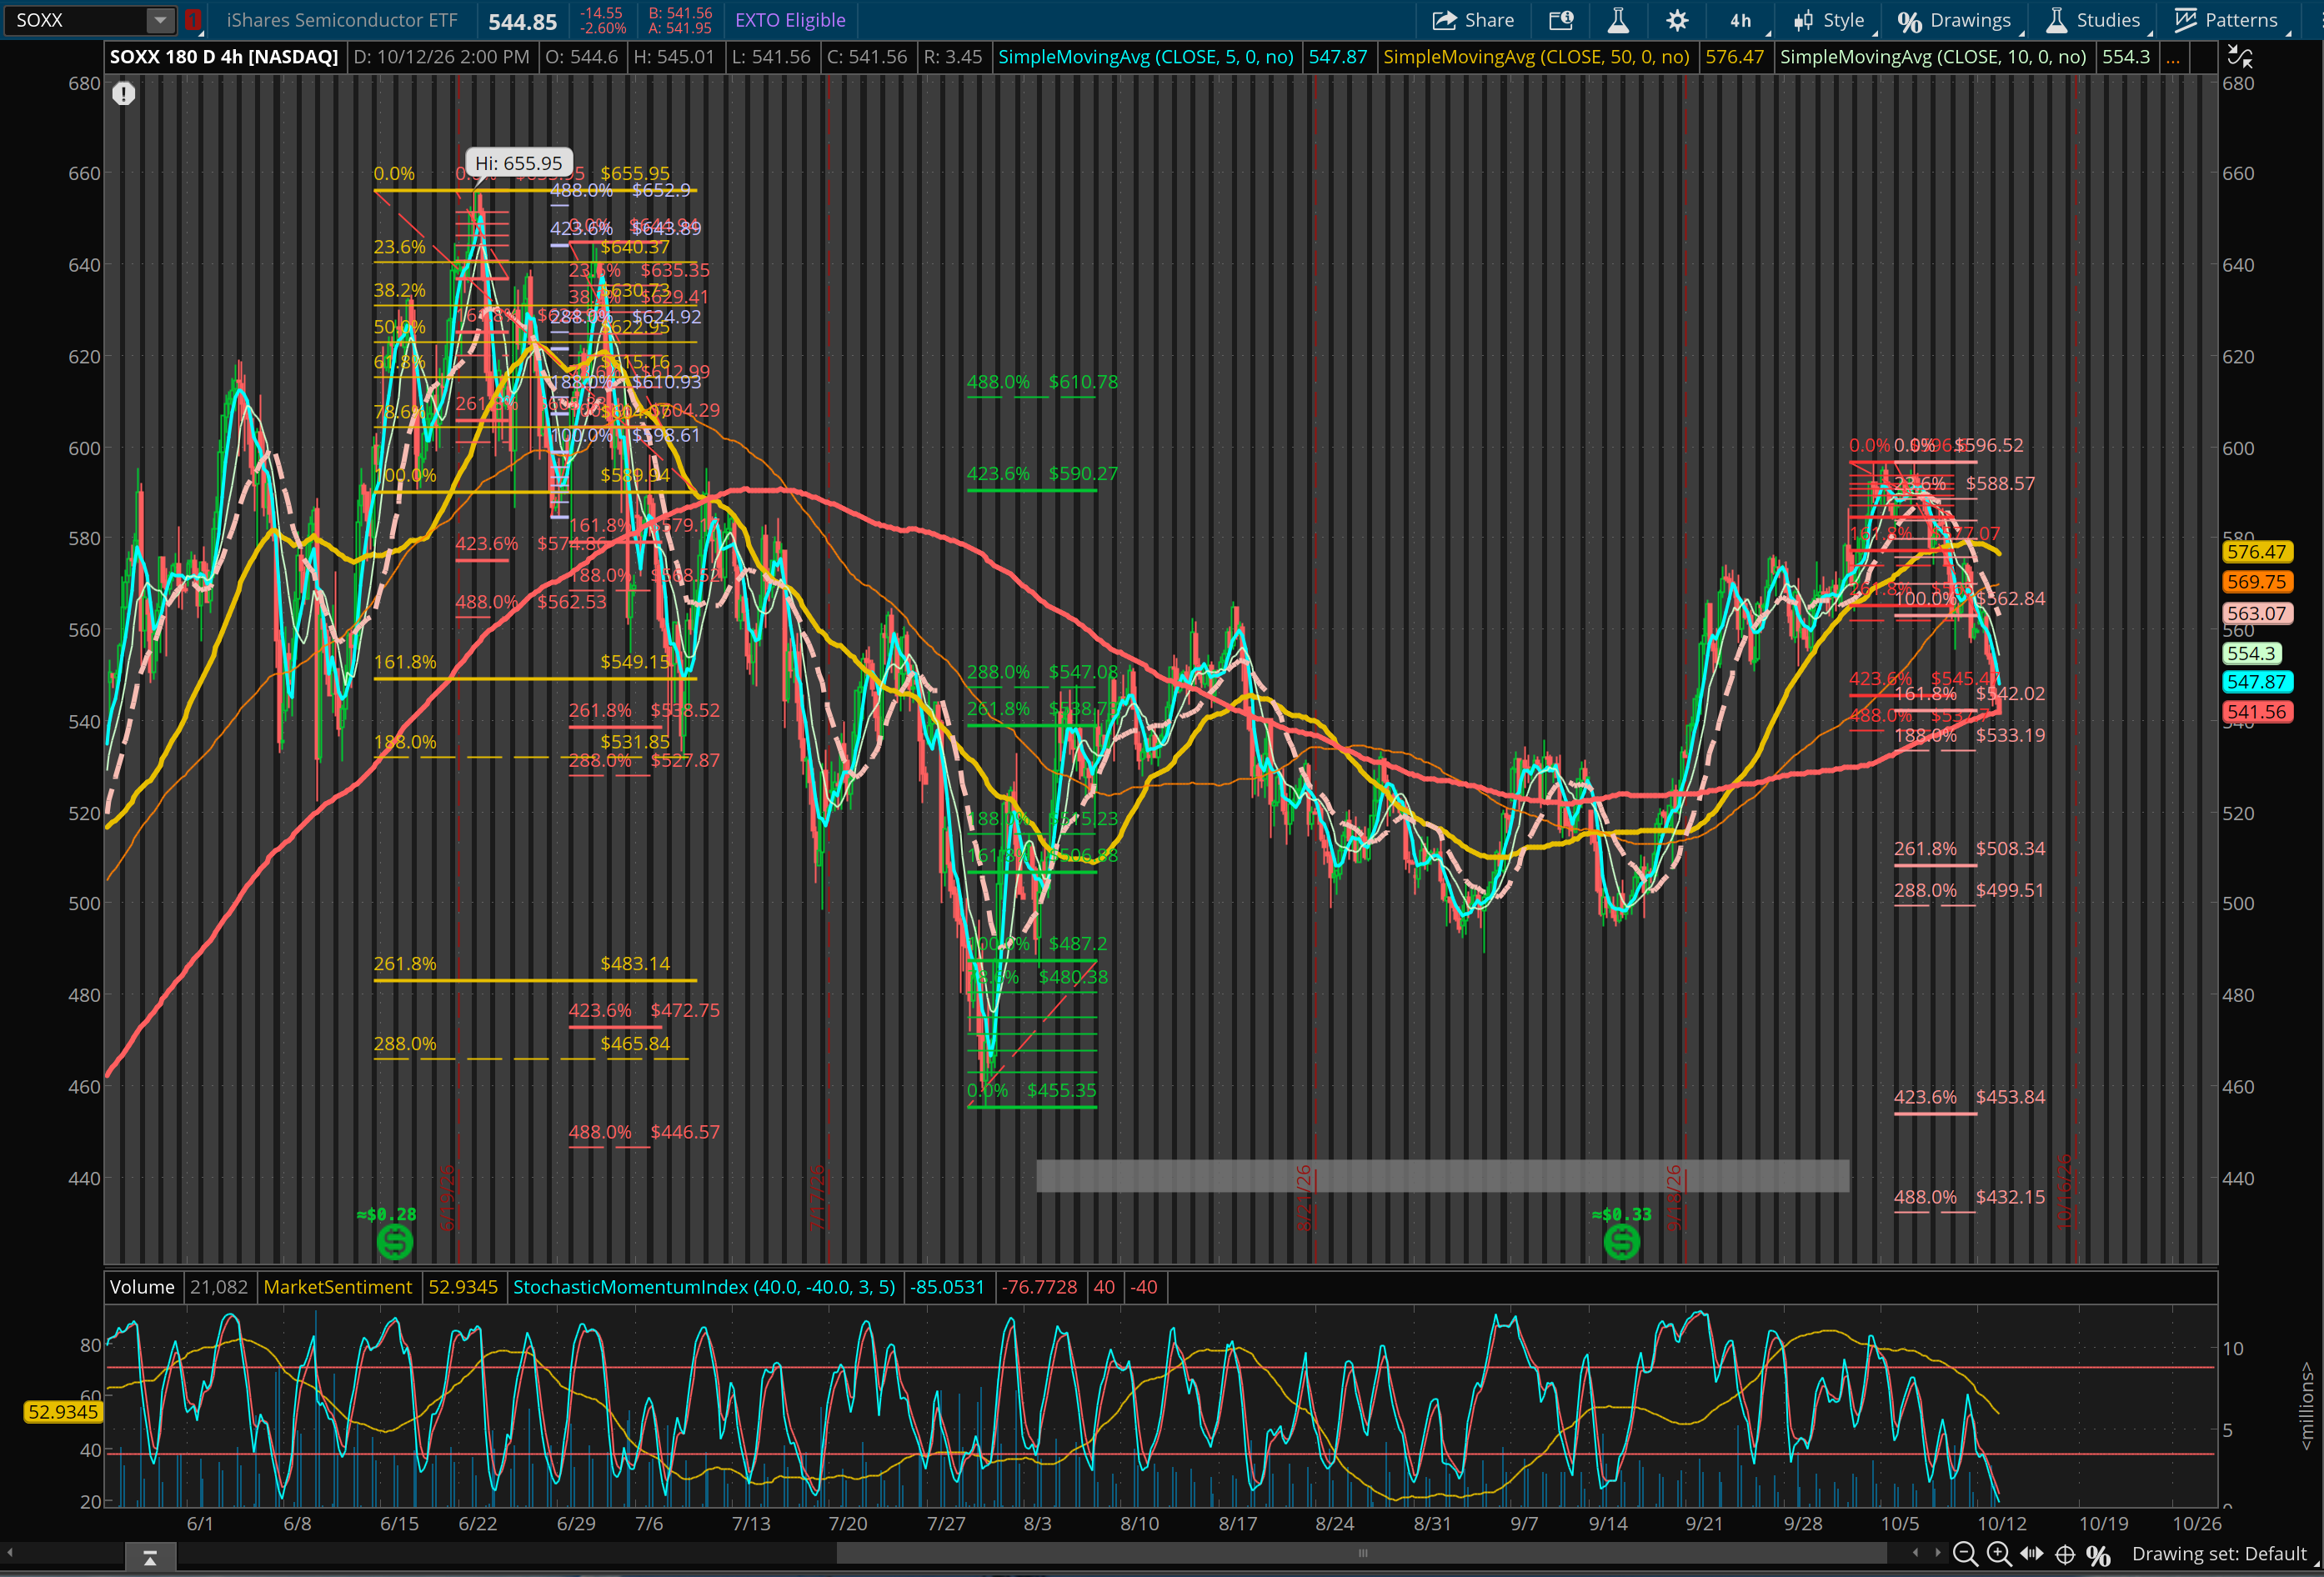 SOXX has finished a 4h move down (red signal on the left), a 4h move up (green signal in the middle), and now on another 4h move down (red signal on the right). There are a weak and a strong signal that we are tracking on, while for the weak one we have actually finished TP3 so it's very likely that we have bottomed here in the short term and a bounce back up is imminent. However, if it decides to continue moving down then we will likely see a much lower target in the future like TP2: 500 or TP3: 432-453.
SMH
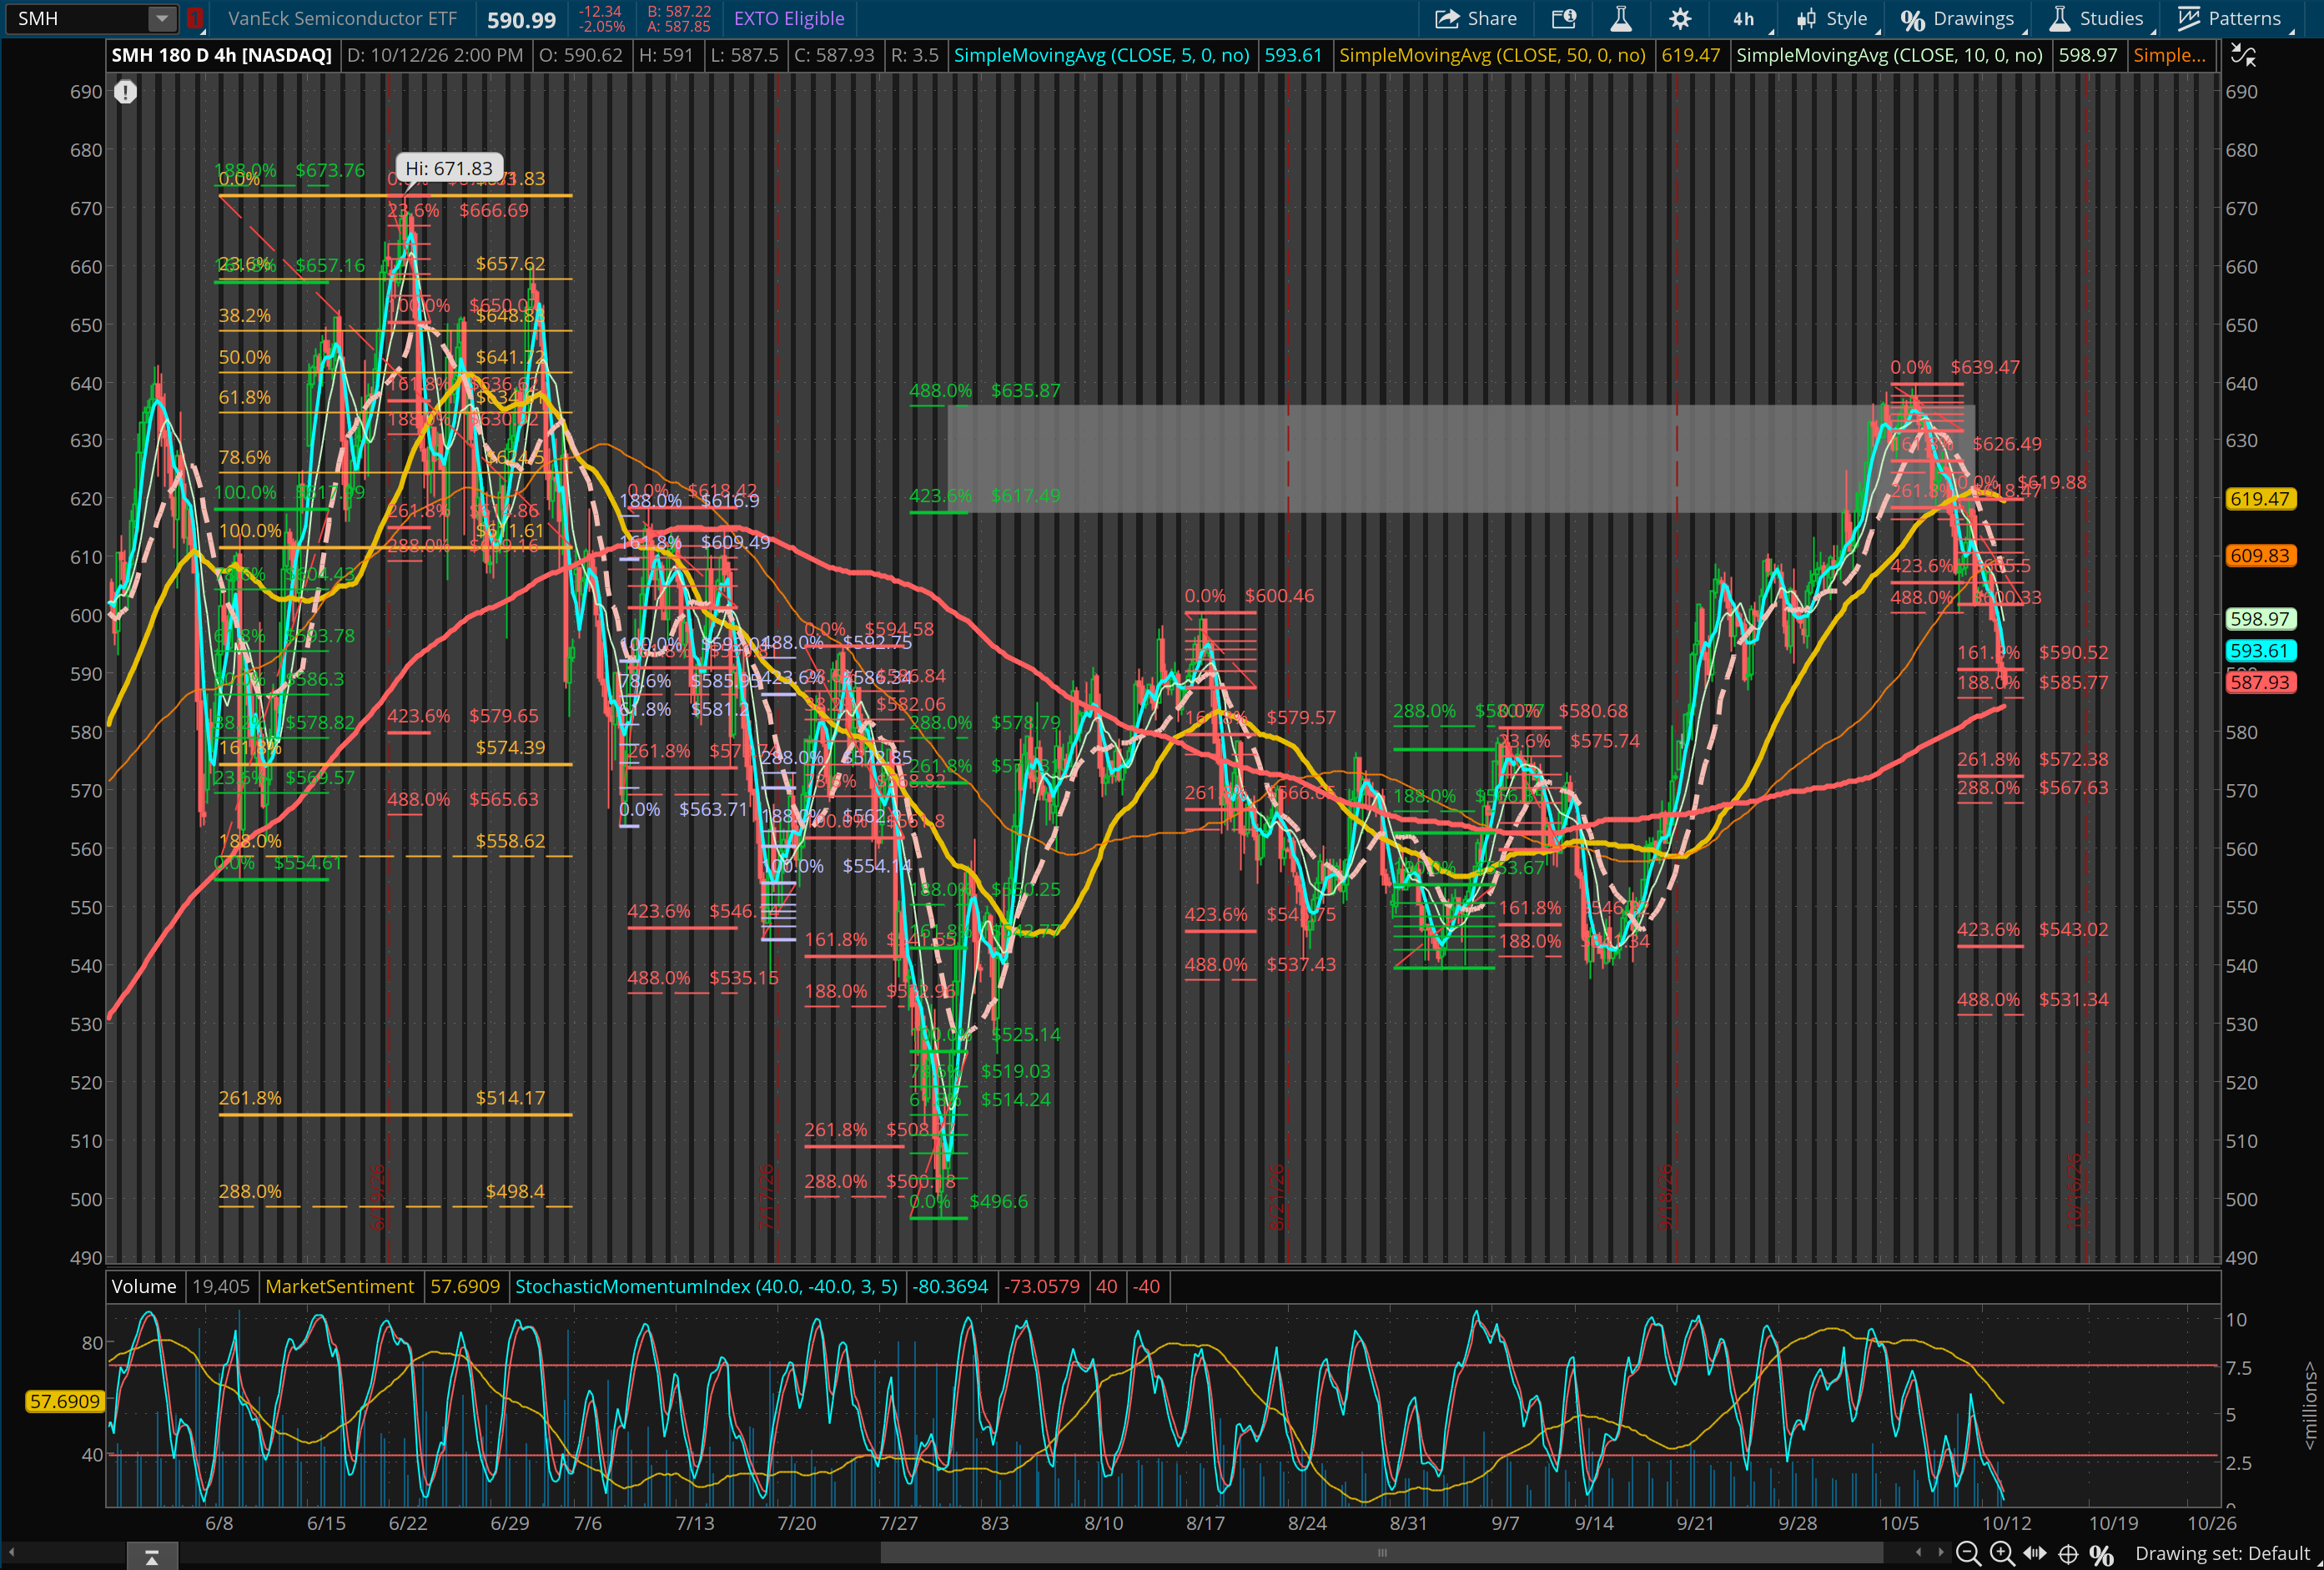 SMH signals are slightly different. It has finished the first 4h bearish signal and started on the second one with TP1 achieved. It's also likely that it has bottomed in the short term.
Updates (2)
Update · October 13, 2026
Update: SMH/SOXX (Oct 13, 2026, 8:40 AM PDT) More downside to come but a bounce likely
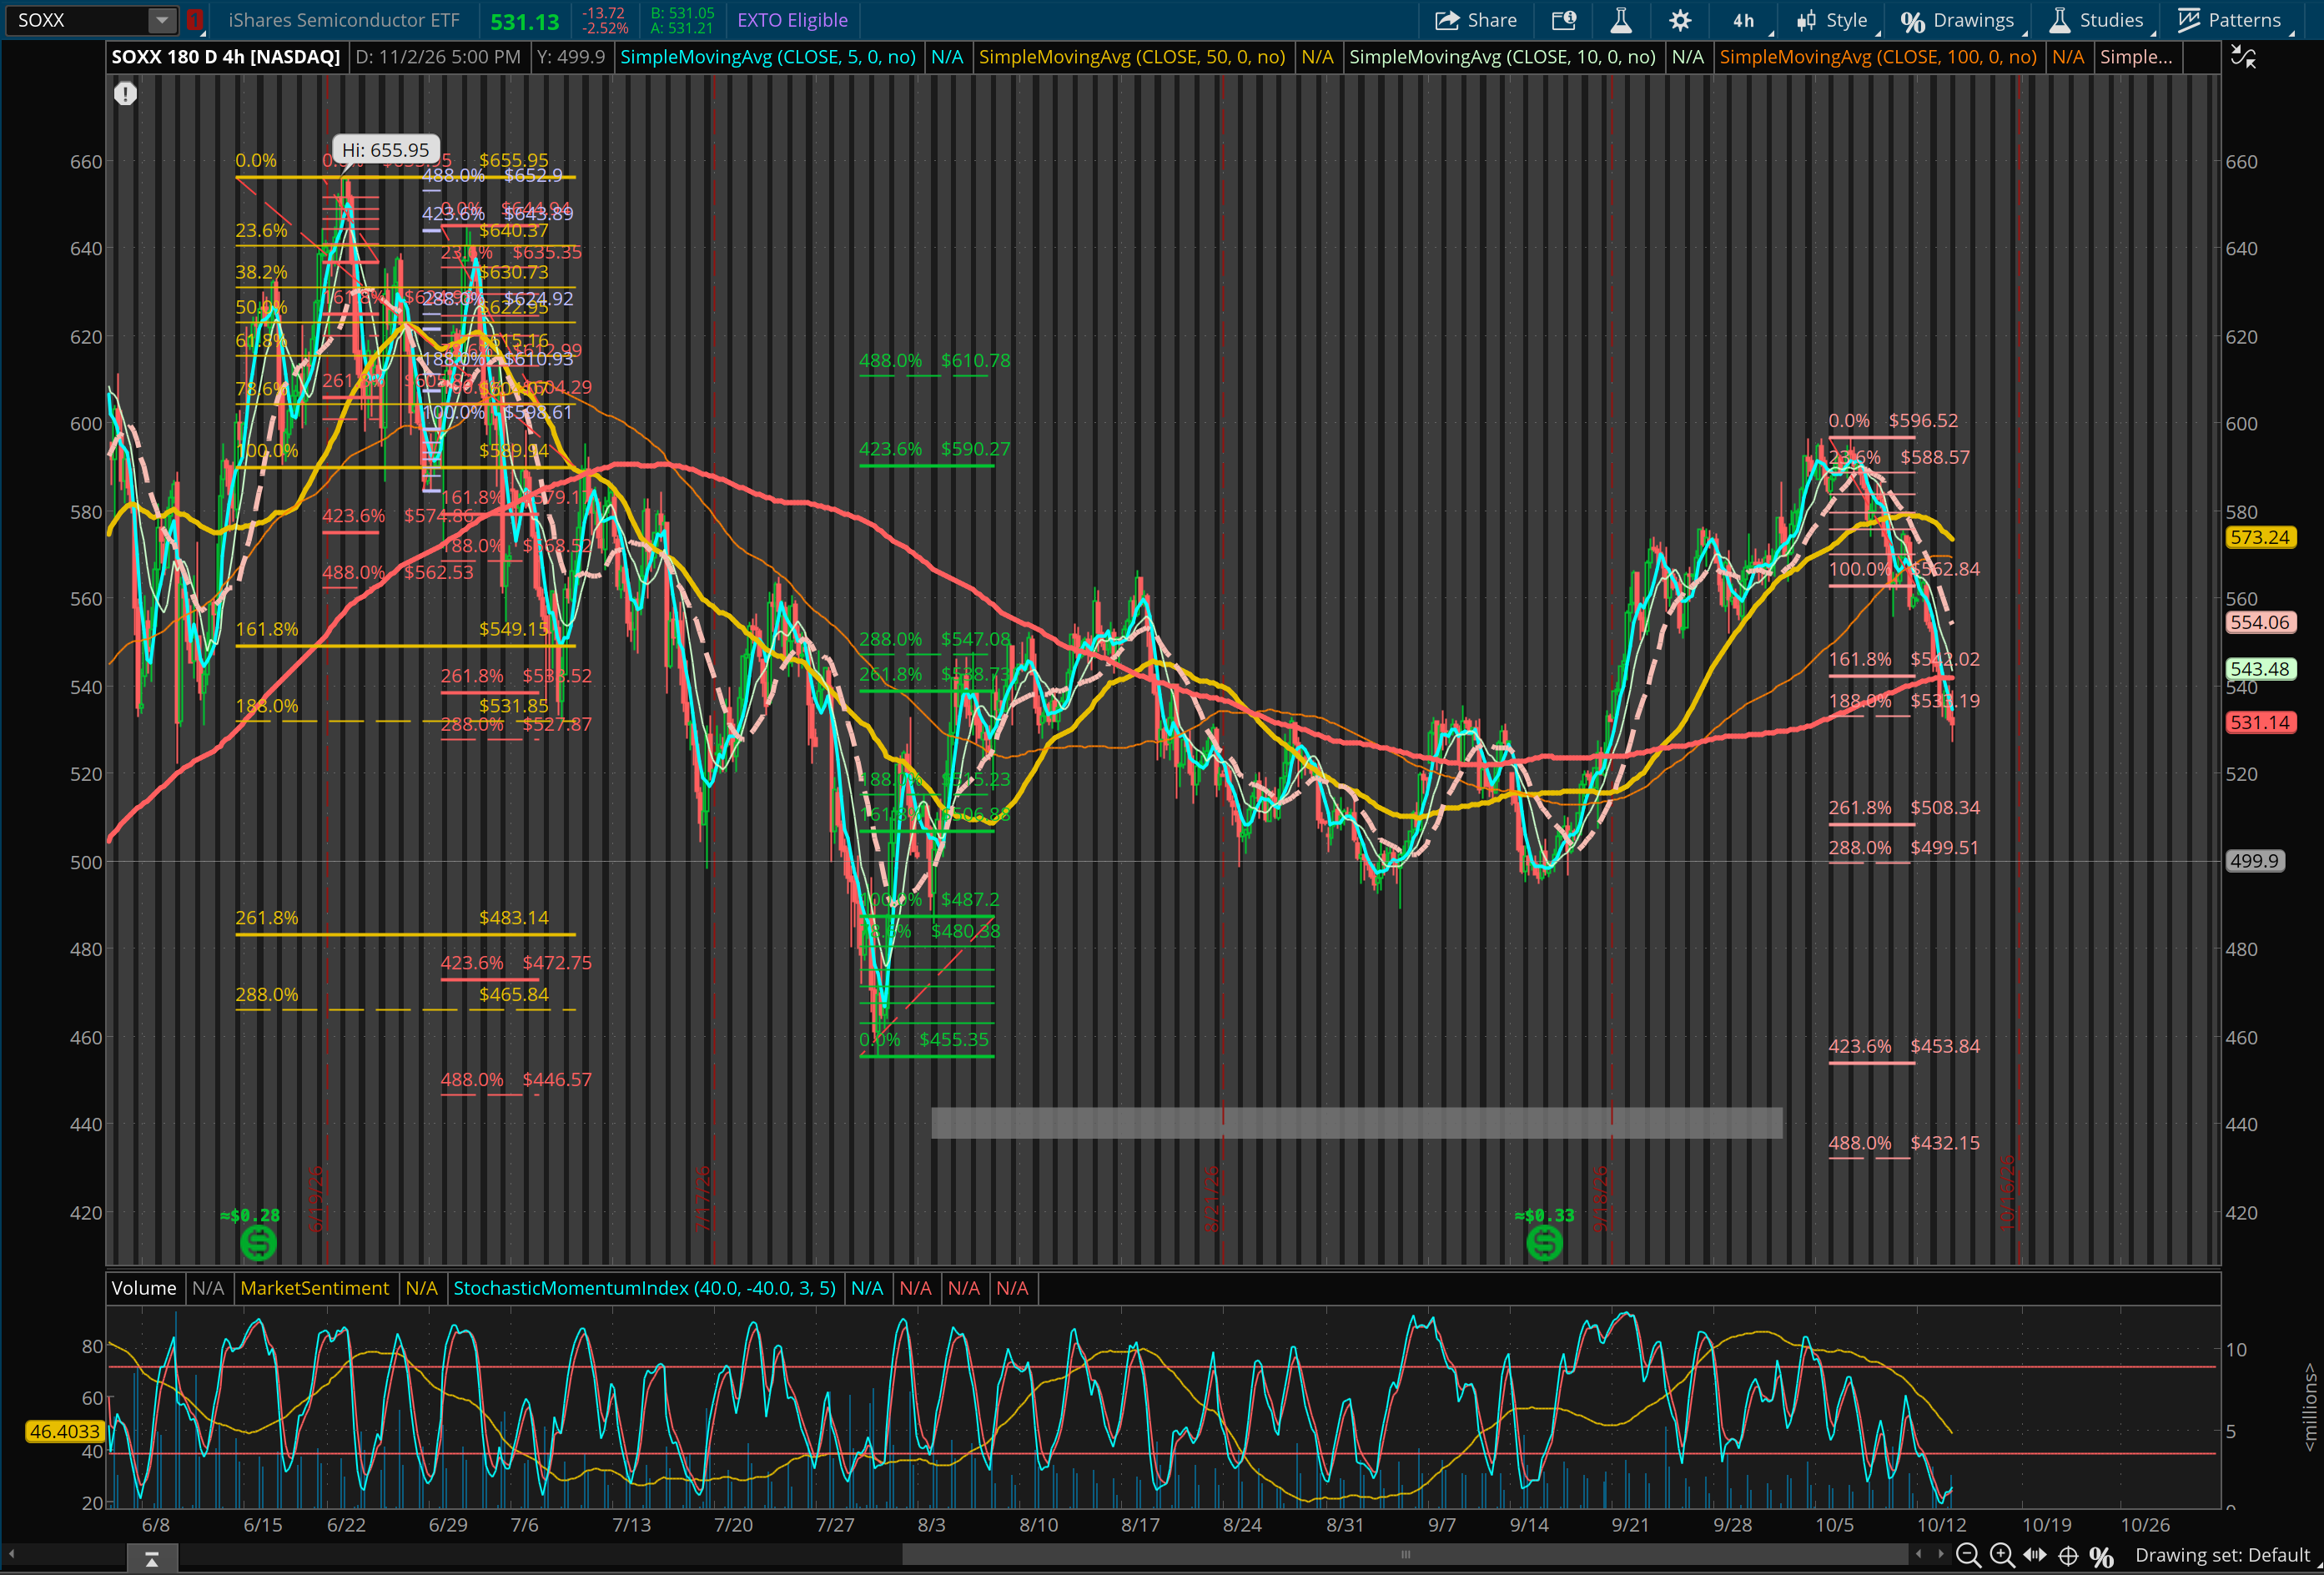 Both SMH and SOXX confirmed continued downtrend intent. SOXX just breached the smaller 4h bearish signal and carried on going down.
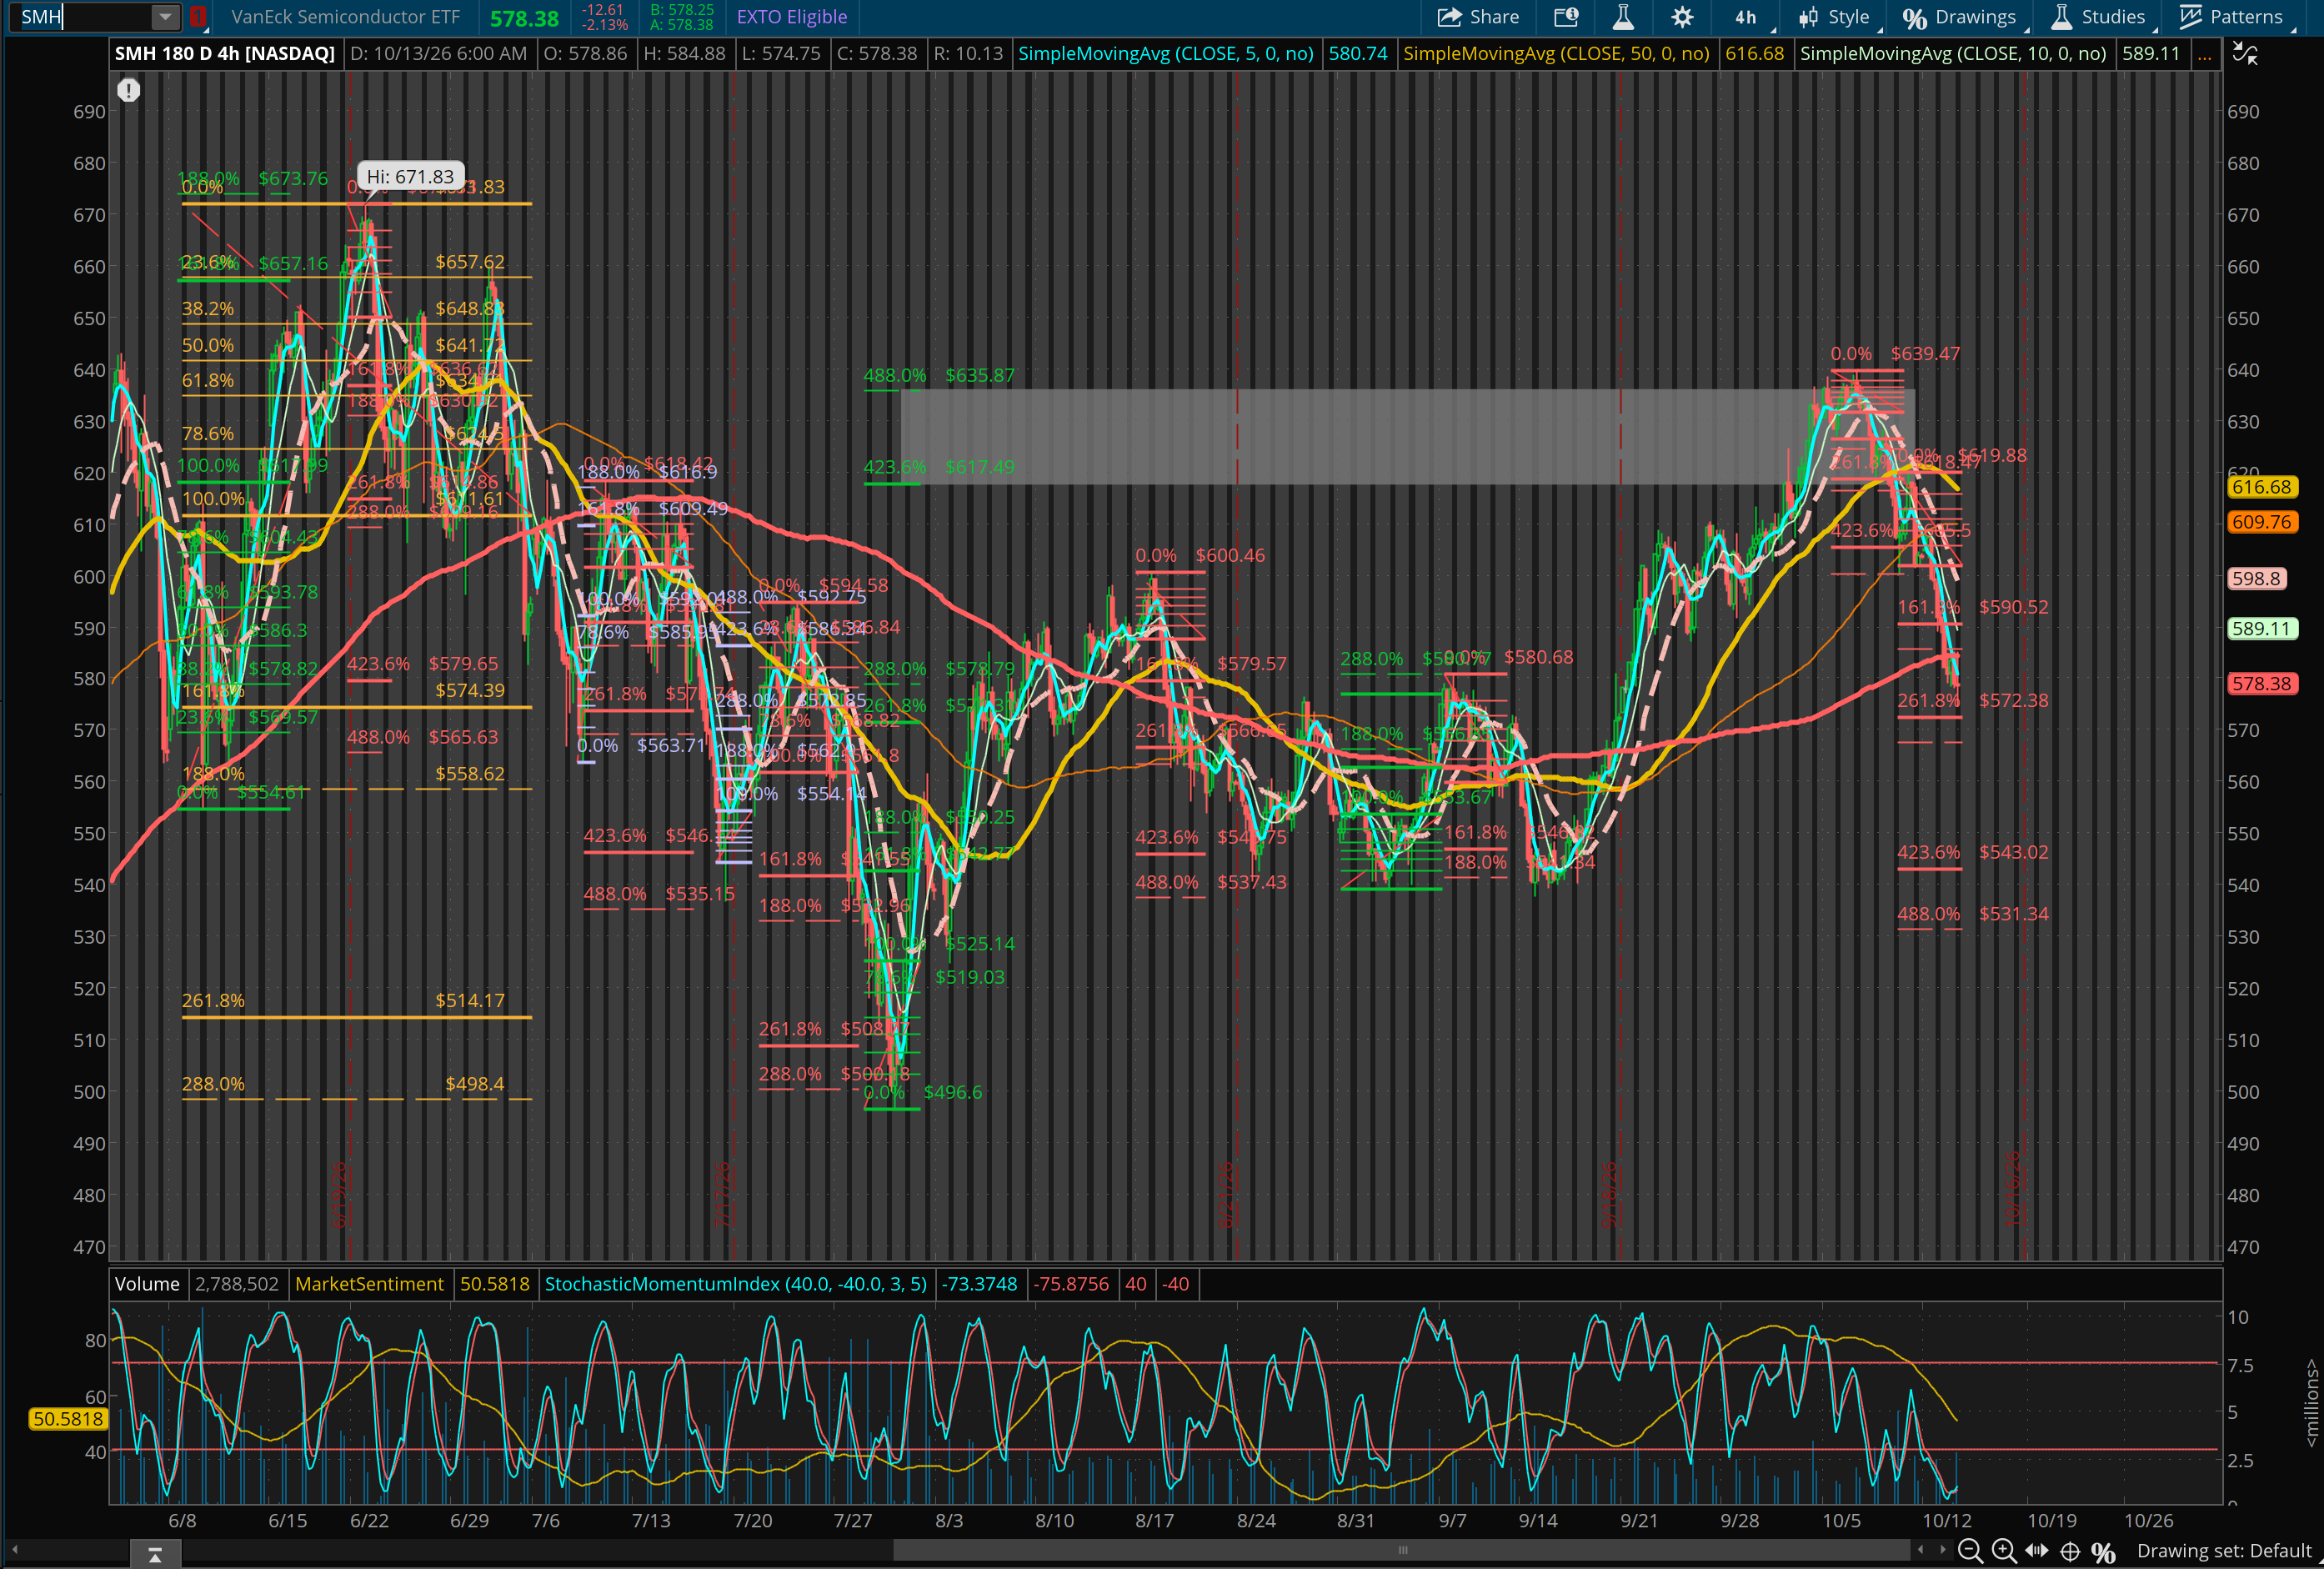 Similarly, SMH continues going down with the second 4h bearish signal.
However, a short-term bounce is likely in the horizon as the momentum indicator has reached extremely oversold region in 4h timeframe.
Update · October 15, 2026
Update: SMH/SOXX short-term pullback target achieved (Oct 15, 2026, 6:43 AM PDT)
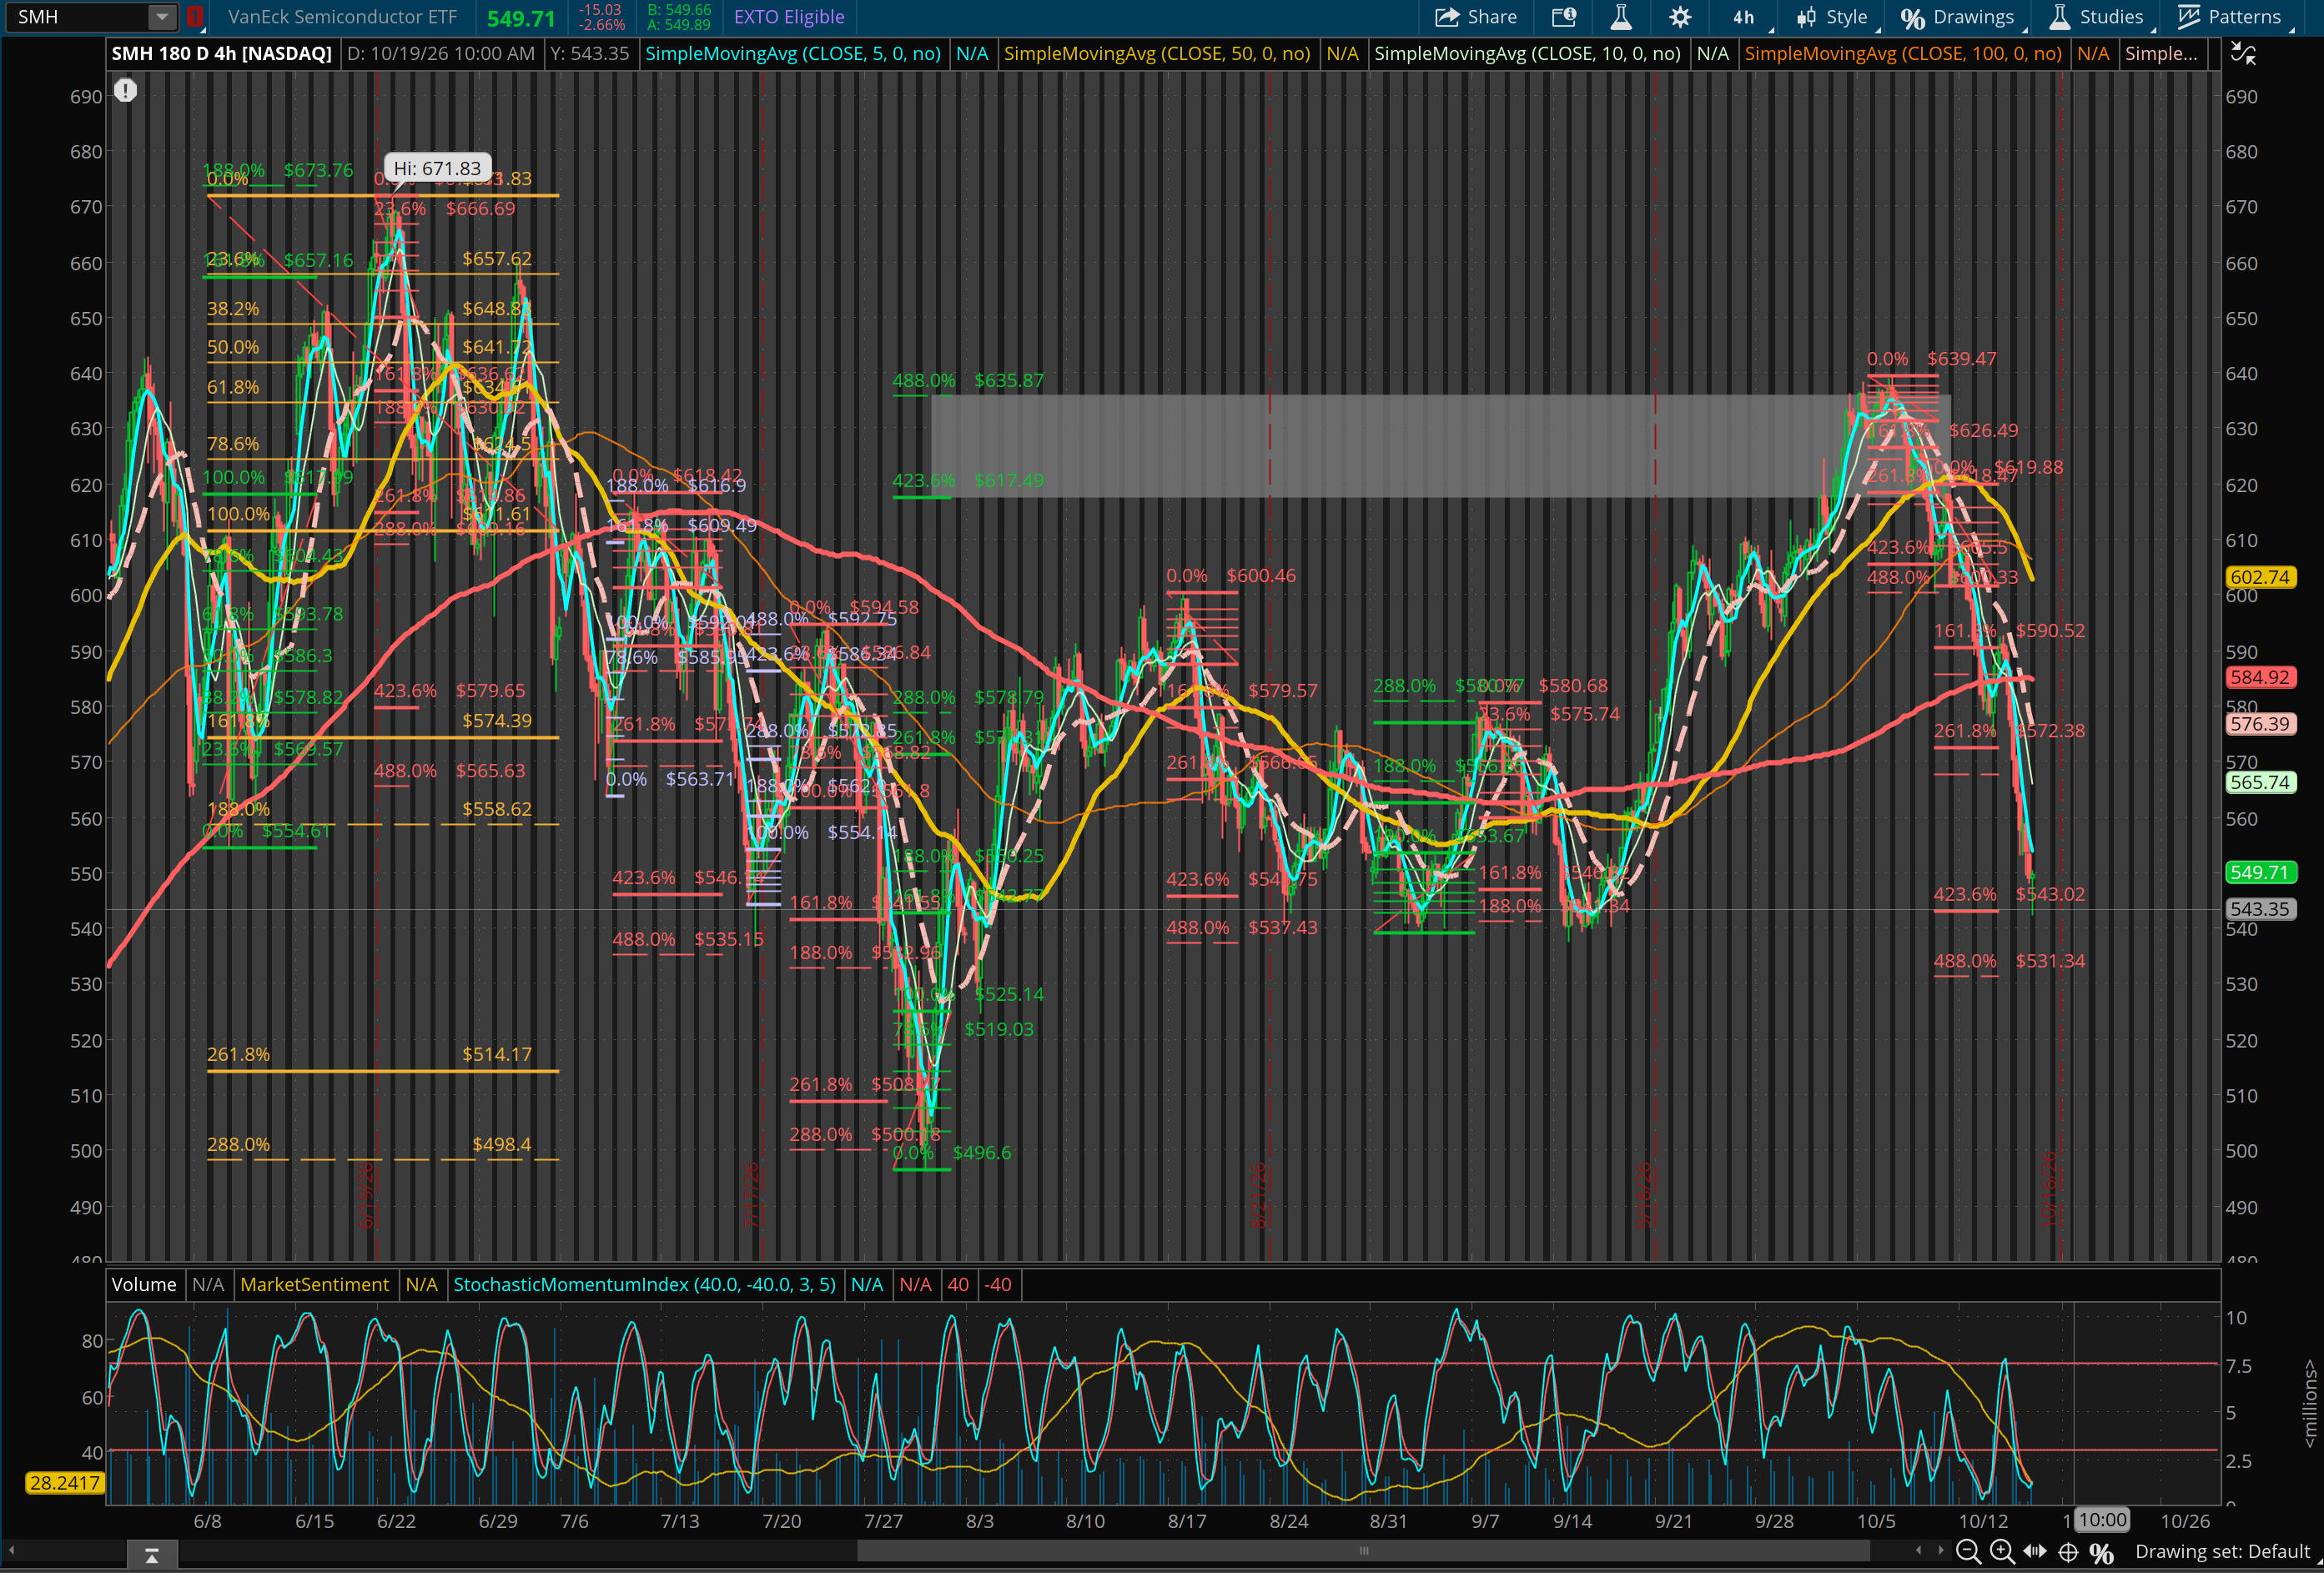
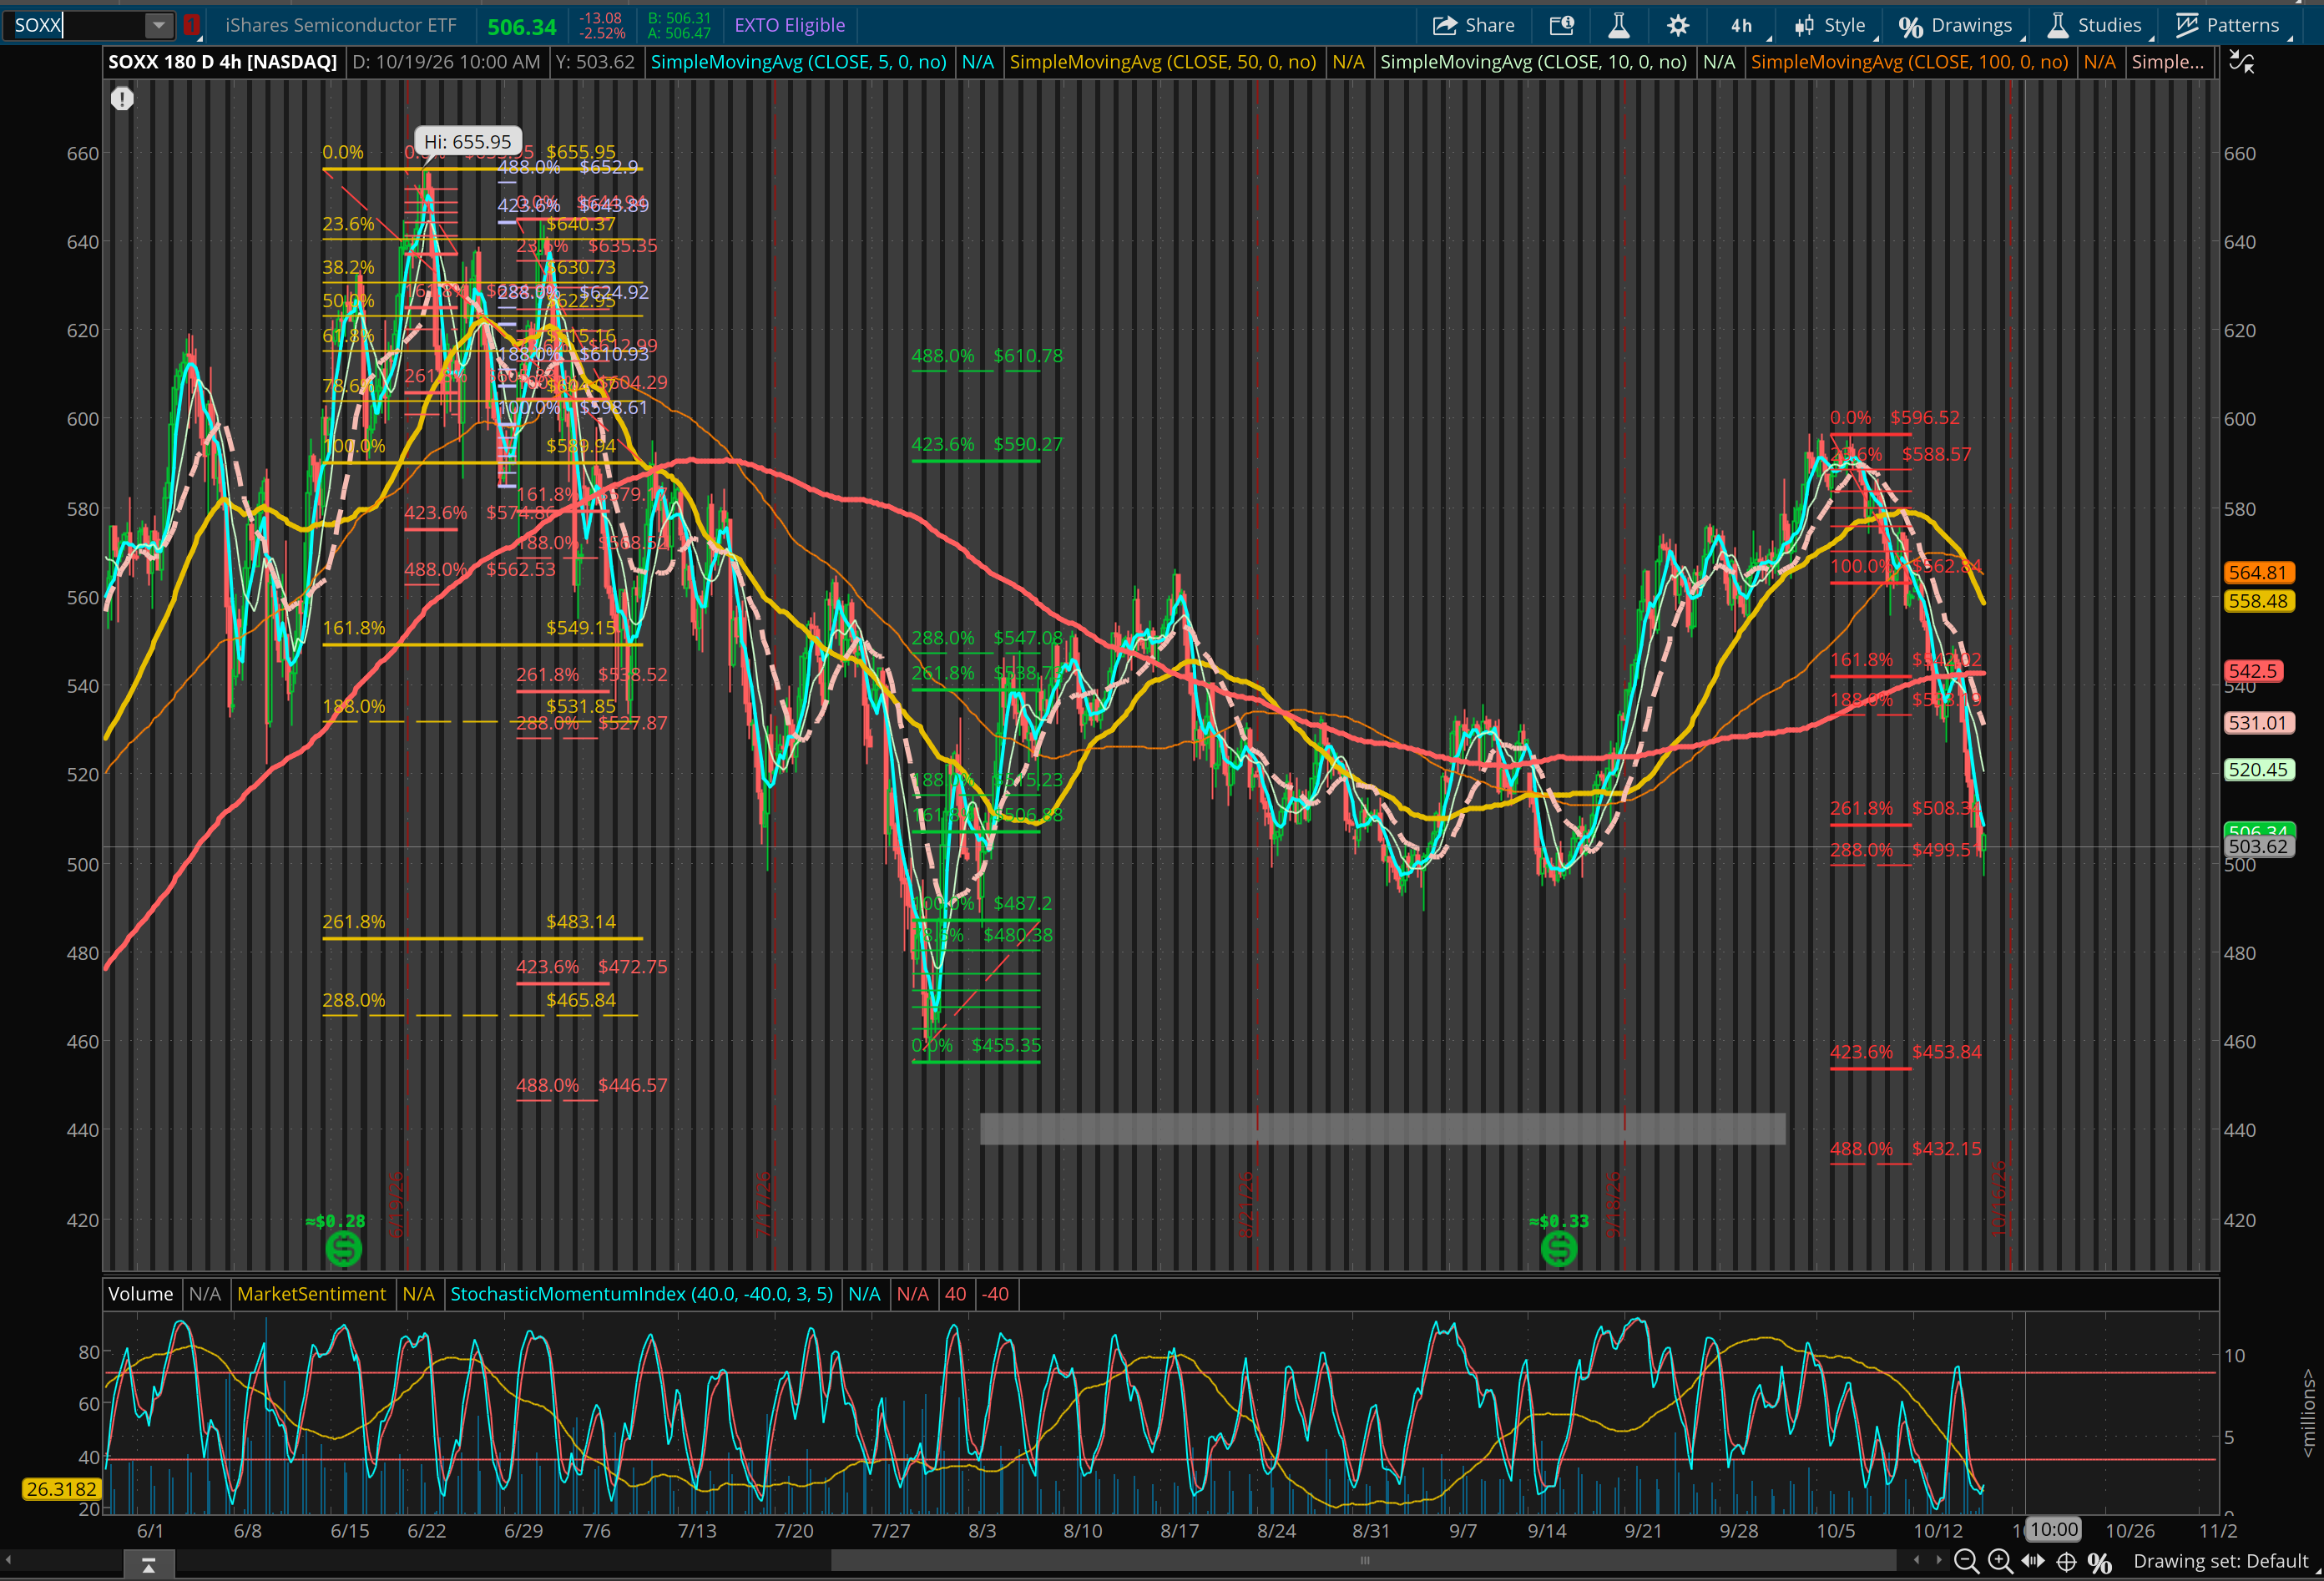 SMH reached 4h TP3 while SOXX achieved 4h TP2. Looking for a larger bounce from here.