Overall Market Strength Analysis
VIX3M / VIX
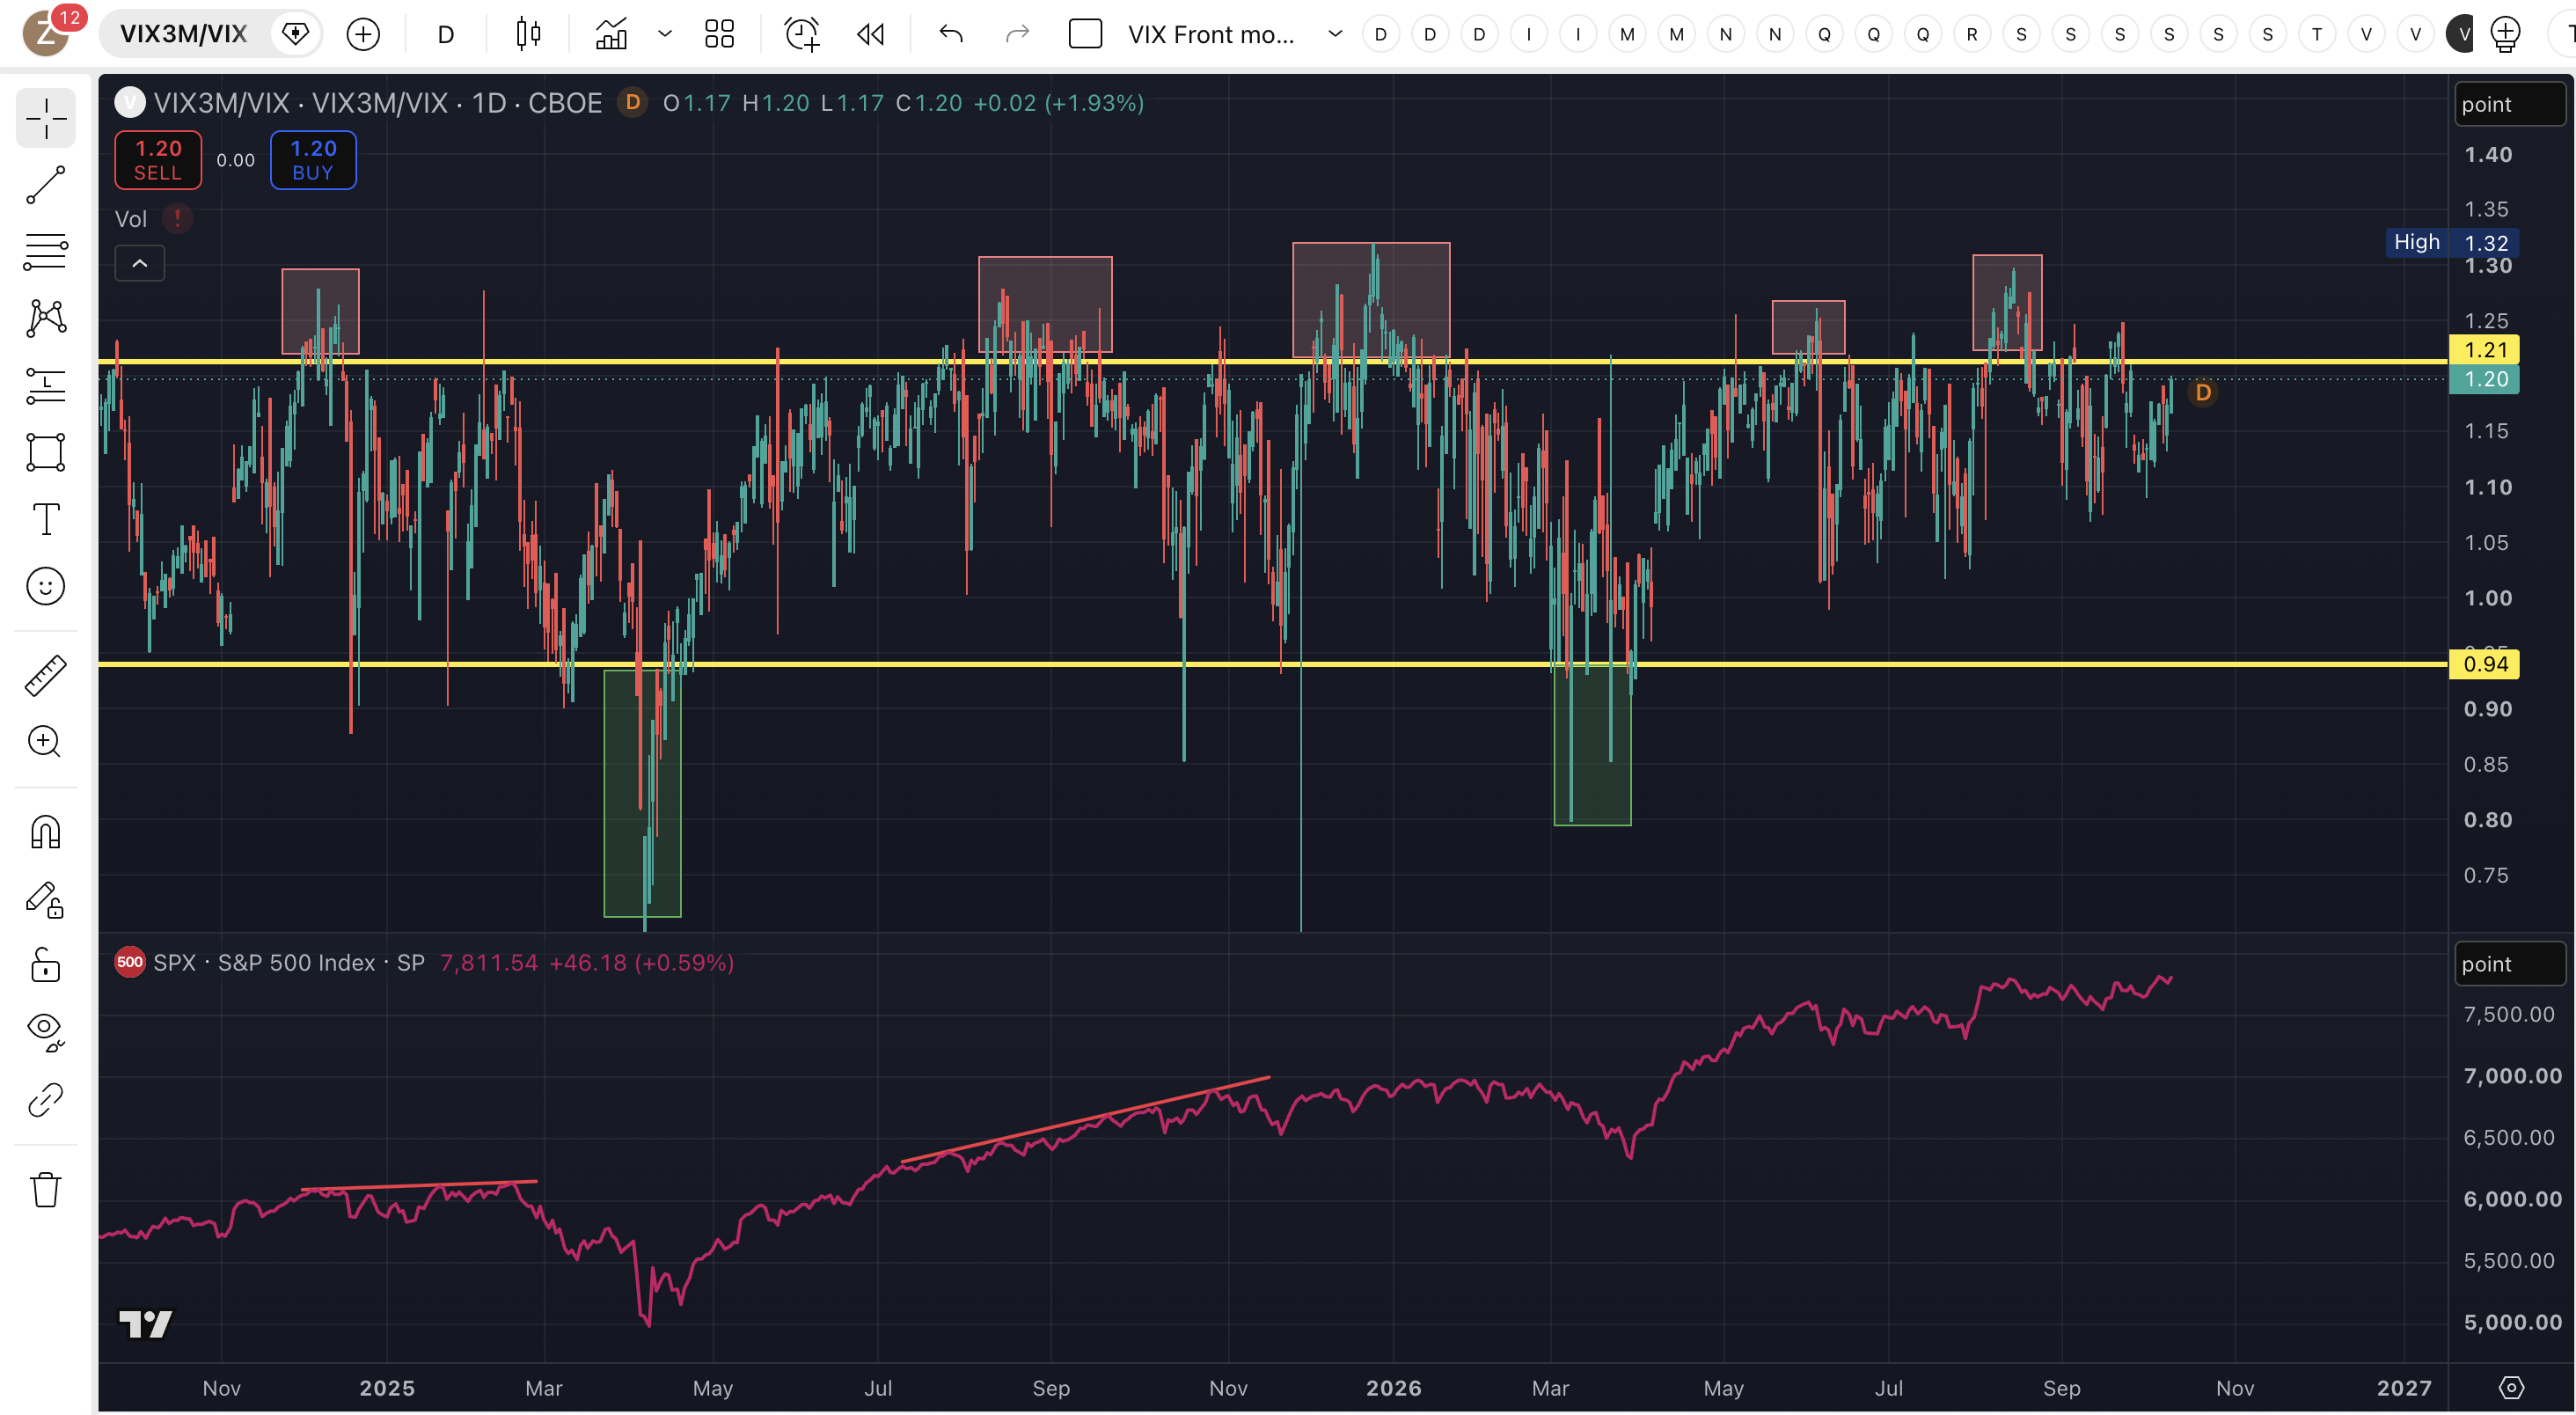
This is front month vs. back month VIX ratio. When it reaches above 1.2, it usually indicate some market risks (or at least pullback in time) afterwards. We are now approaching that ratio once more.
 ## Smart Money vs. Dumb Money
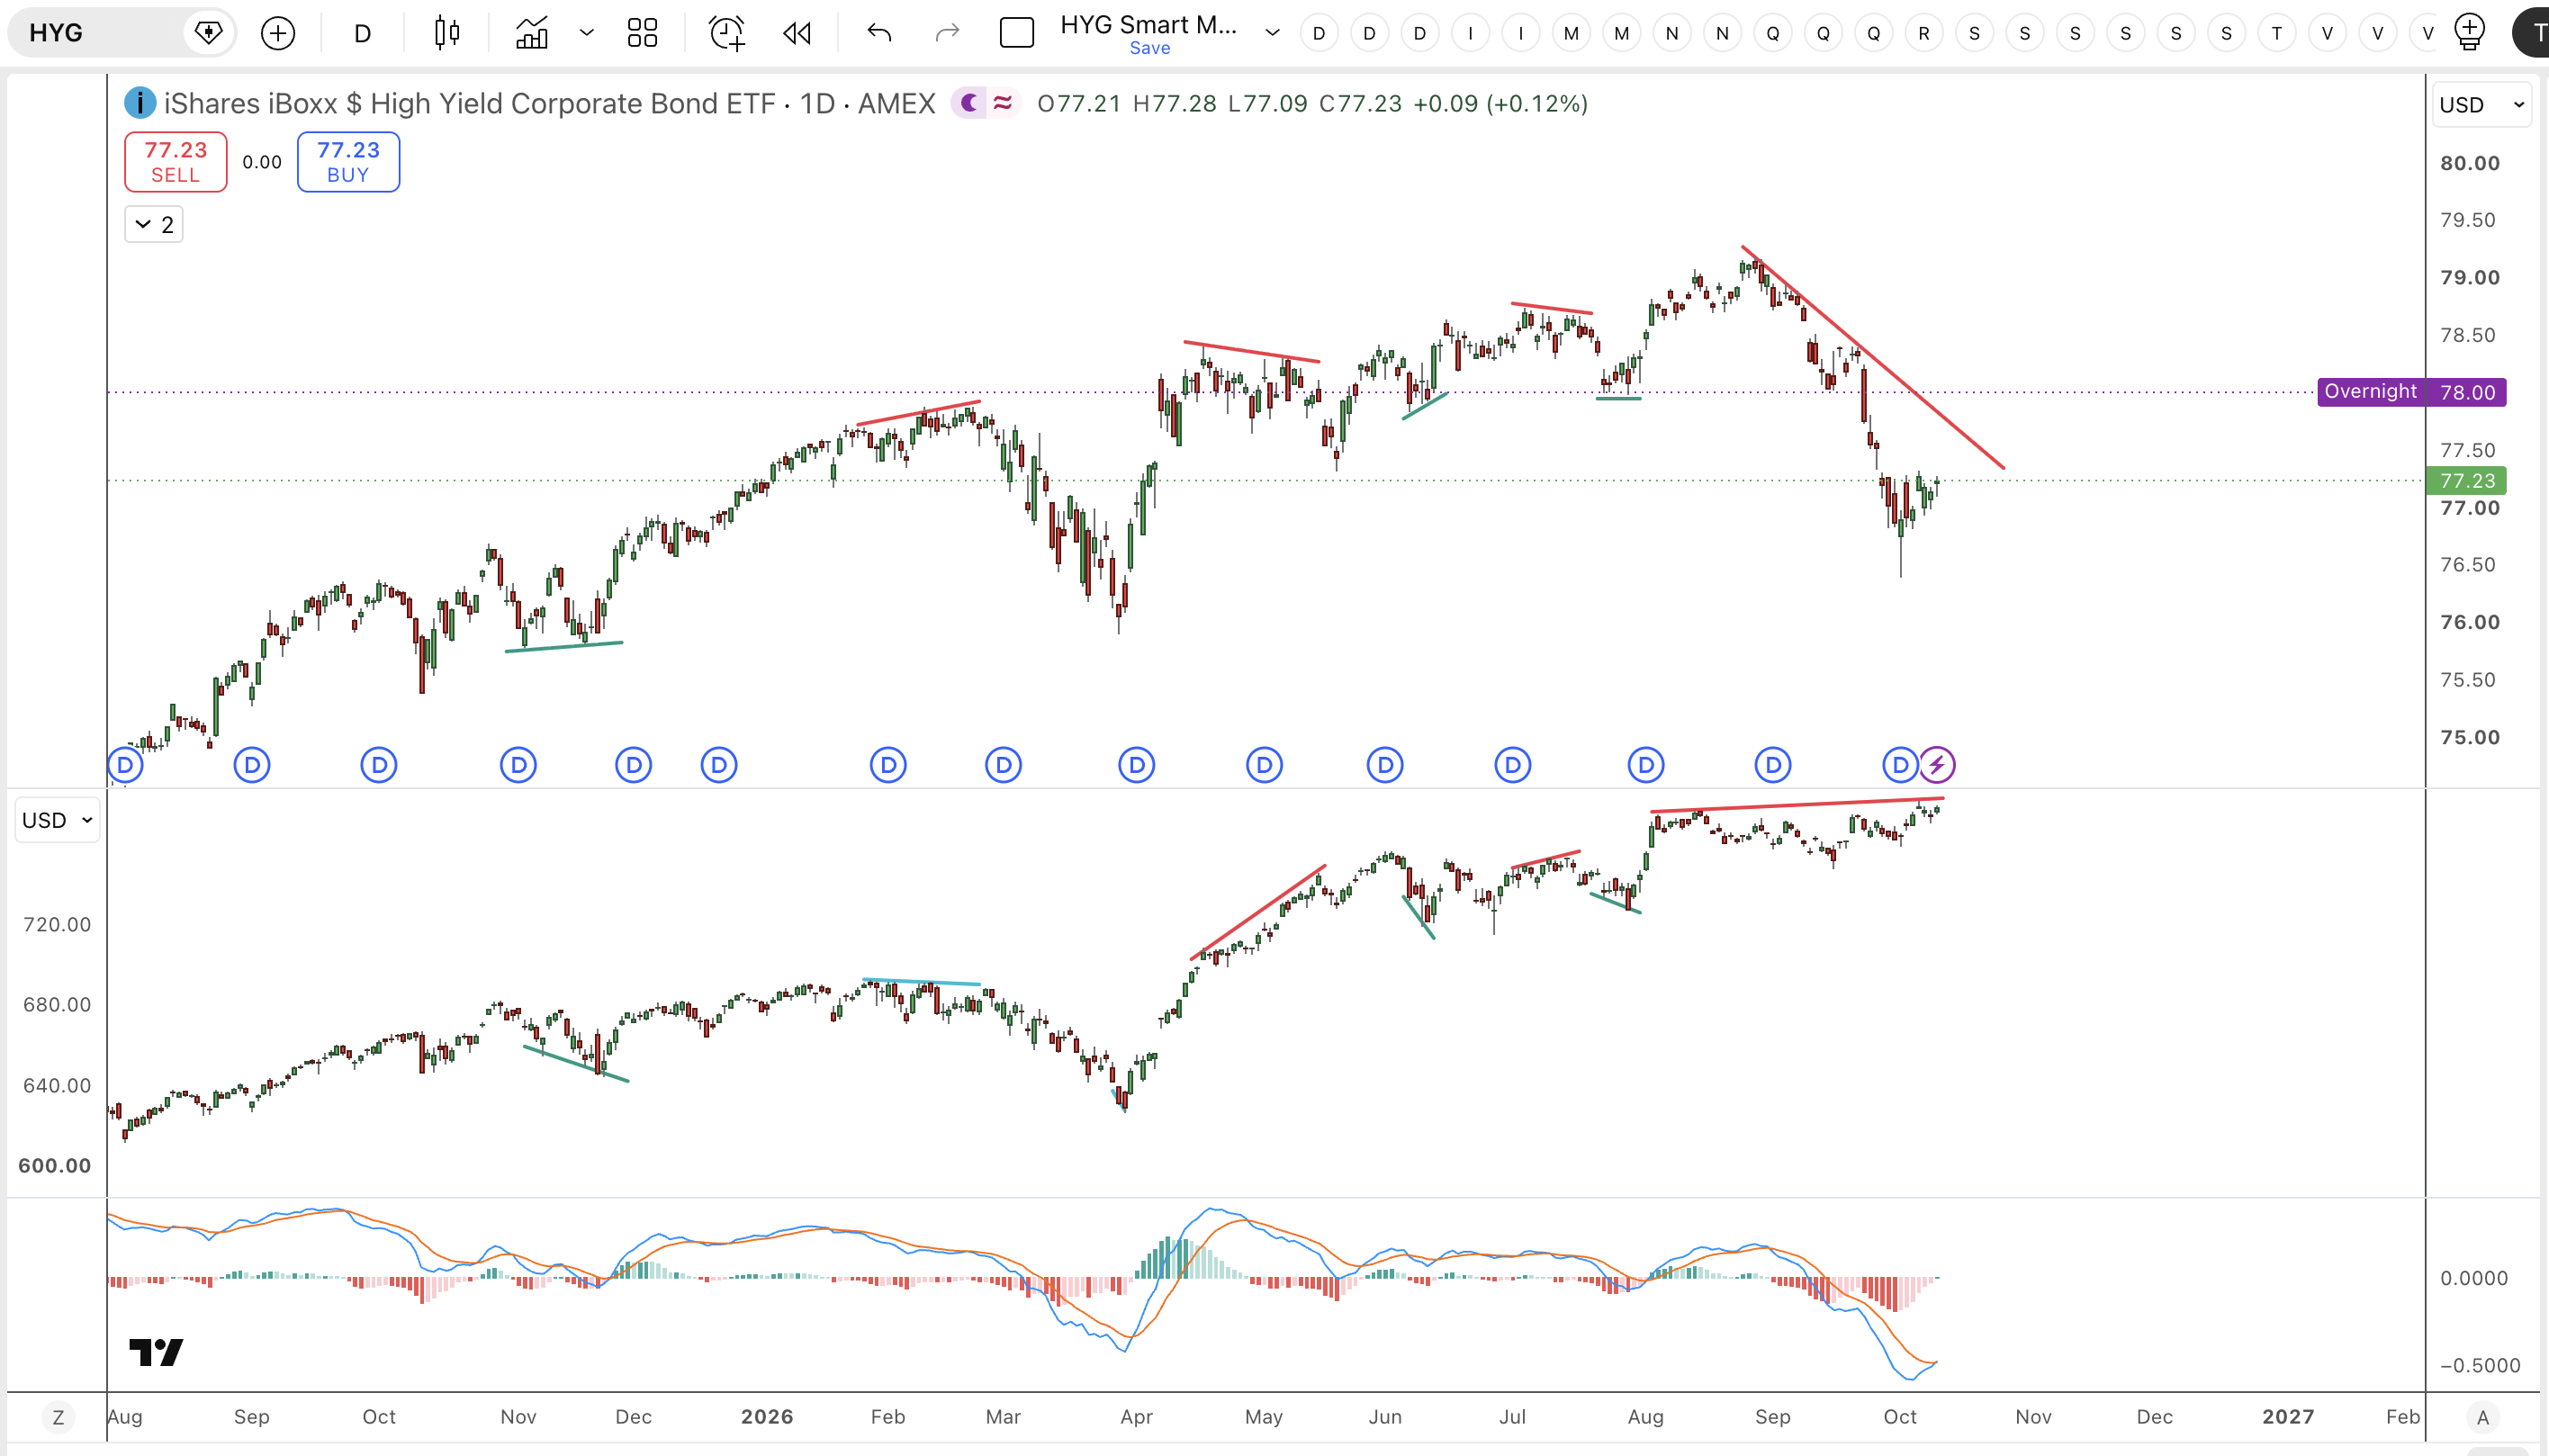
This chart has worried me quite a lot. In the past when HYG (high-yield bond, a.k.a smart money) makes a lower high while SPX (a.k.a dumb money) makes a higher high, that usually predicts a pullback is happening. Vice versa, when HYG makes a higher low while SPX makes a lower low, a bottom or at least a bounce is coming soon. This time HYG dropped pretty substantially while SPX is close to a new high, it means we are facing a ton of risks very soon.
 ## RSP vs. SPX (Equal weight vs. Weighted)
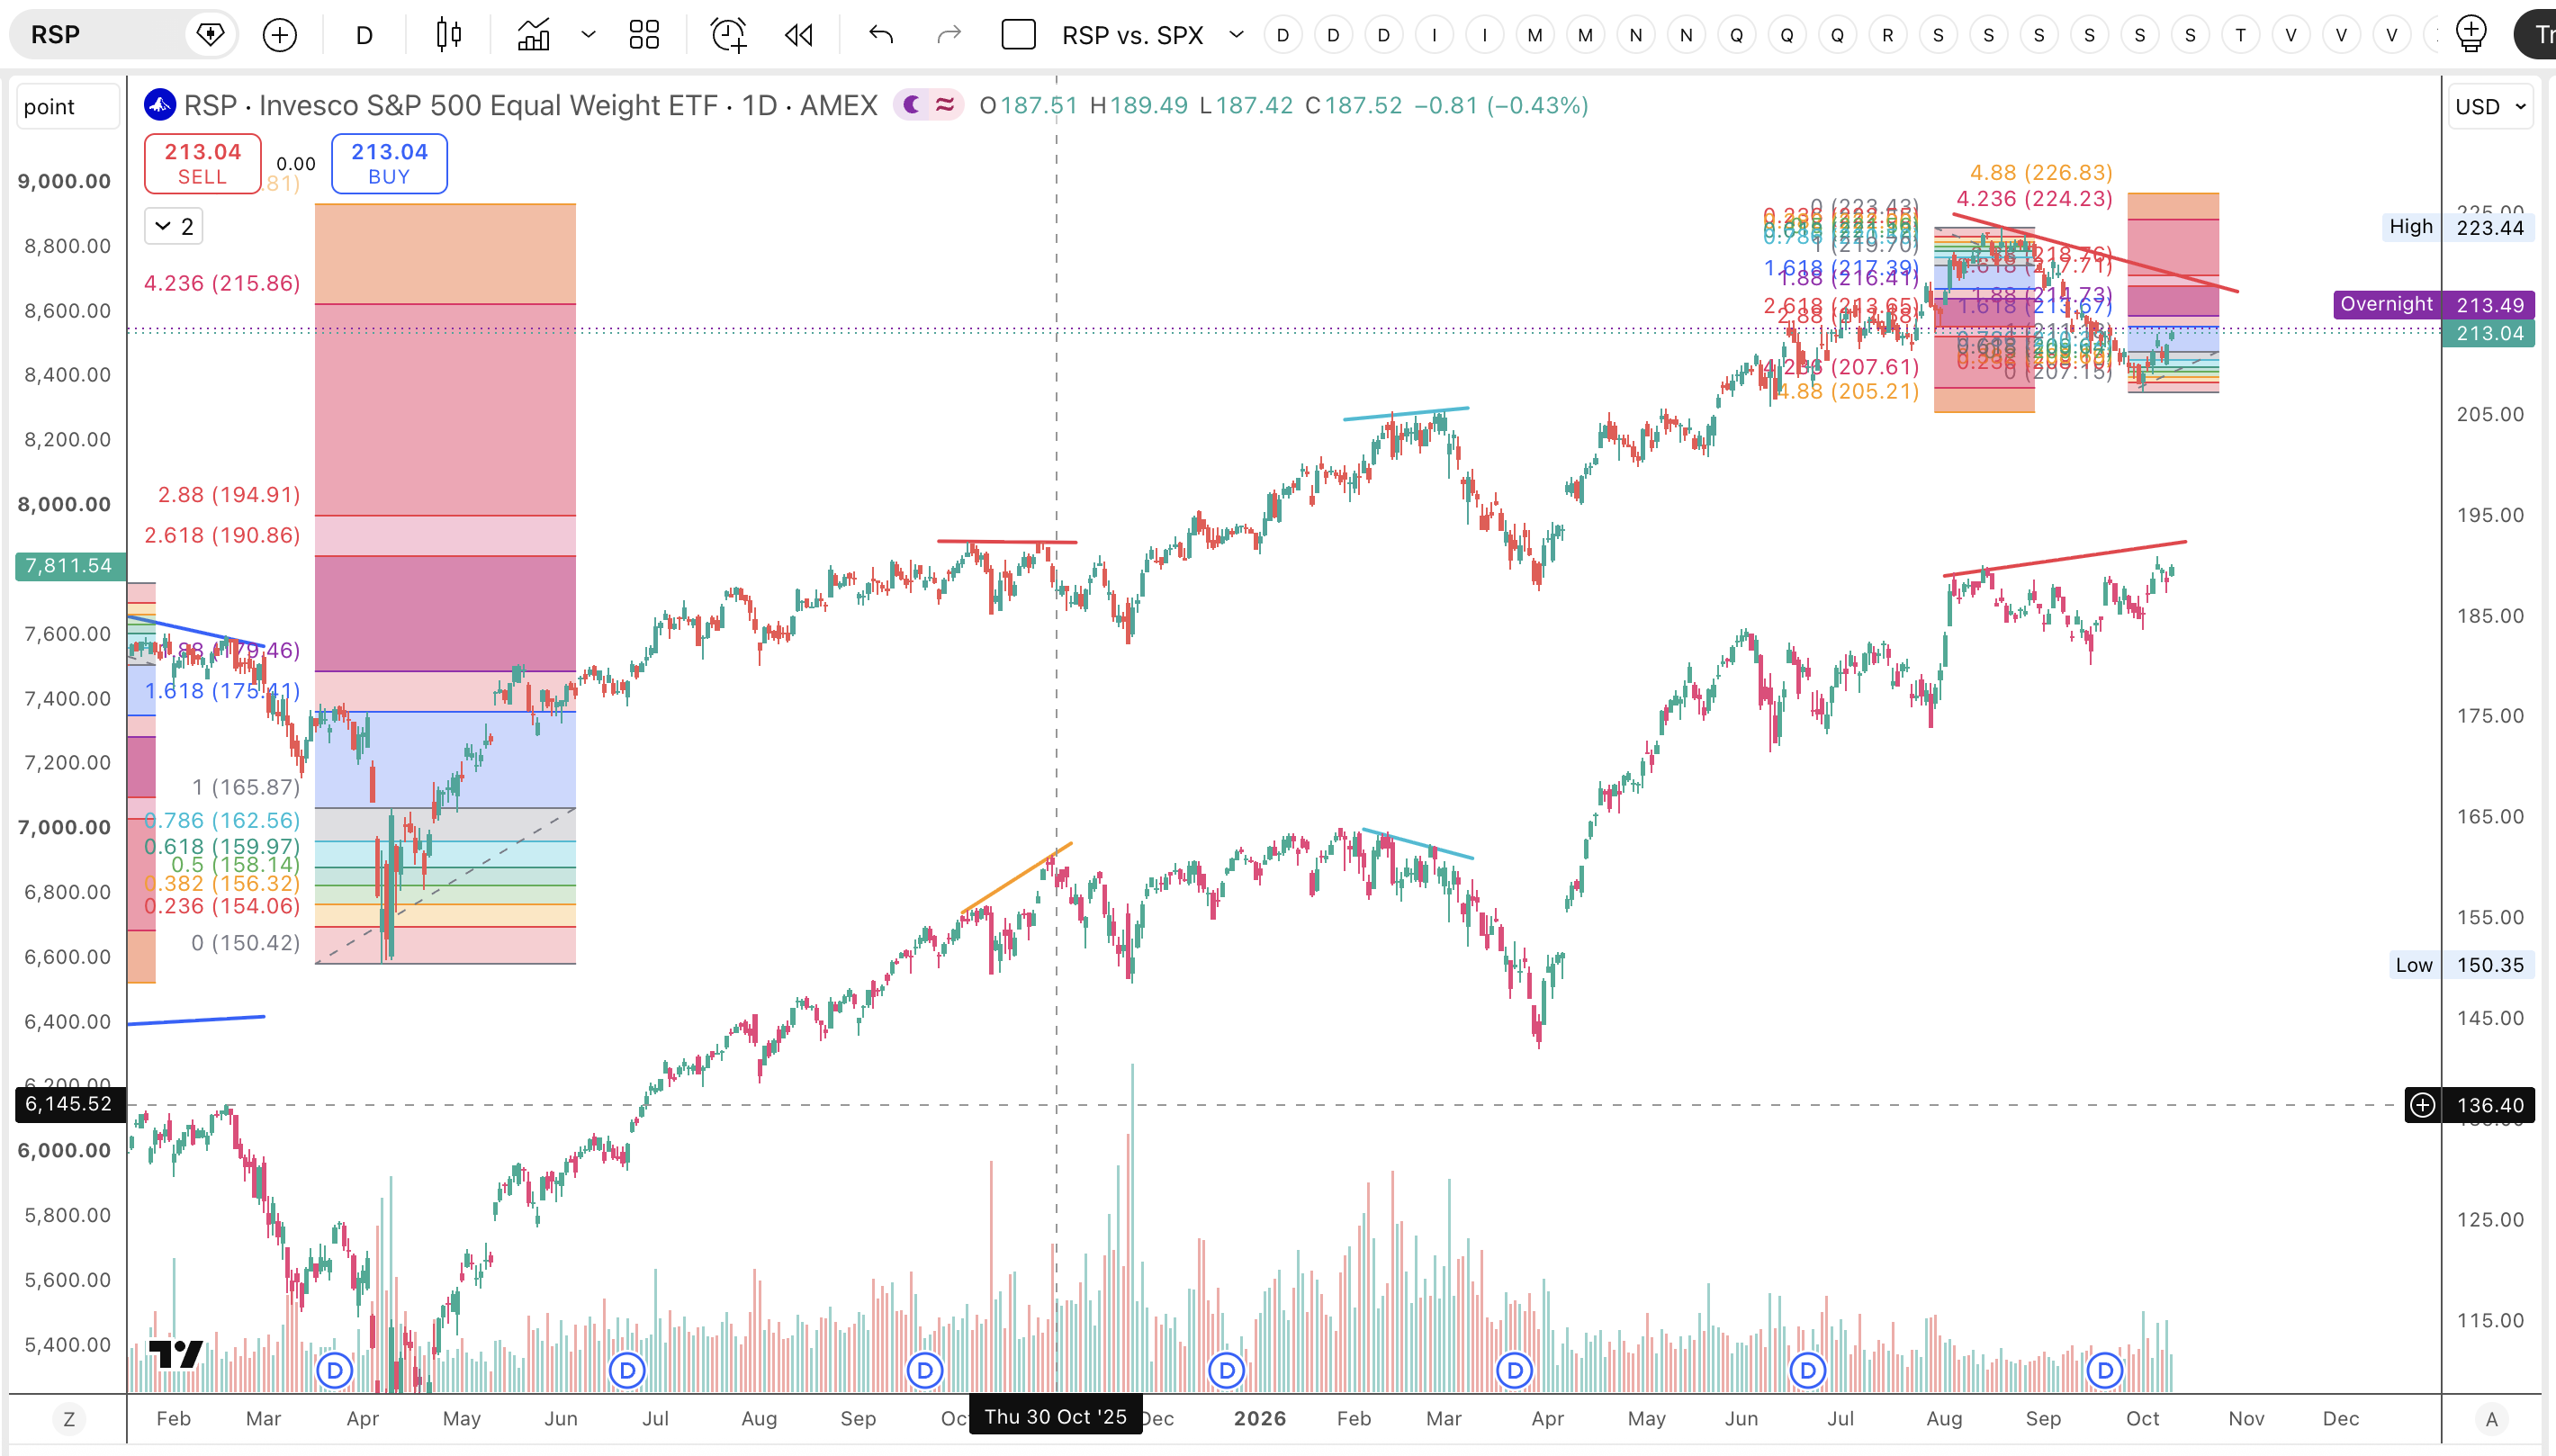
Similarly, equal weight index RSP dropped heavily since it reached TP3 of weekly bullish signal, and touched upon TP3 of daily bearish signal, and now bouncing back on a new daily bullish signal. Most likely we are gonna see a new higher high in SPX while lower high inRSP, which usually predates a market top/pullback happening.
NOTE: All the signals above can be found in "Indicators" page.